67
User Manual
Visit the ViewZ USA website at https://www.viewzusa.com
CONFIG. /INTELLIGENT ANALYSIS
8. Abnormal Speed
Deployment Area Settings
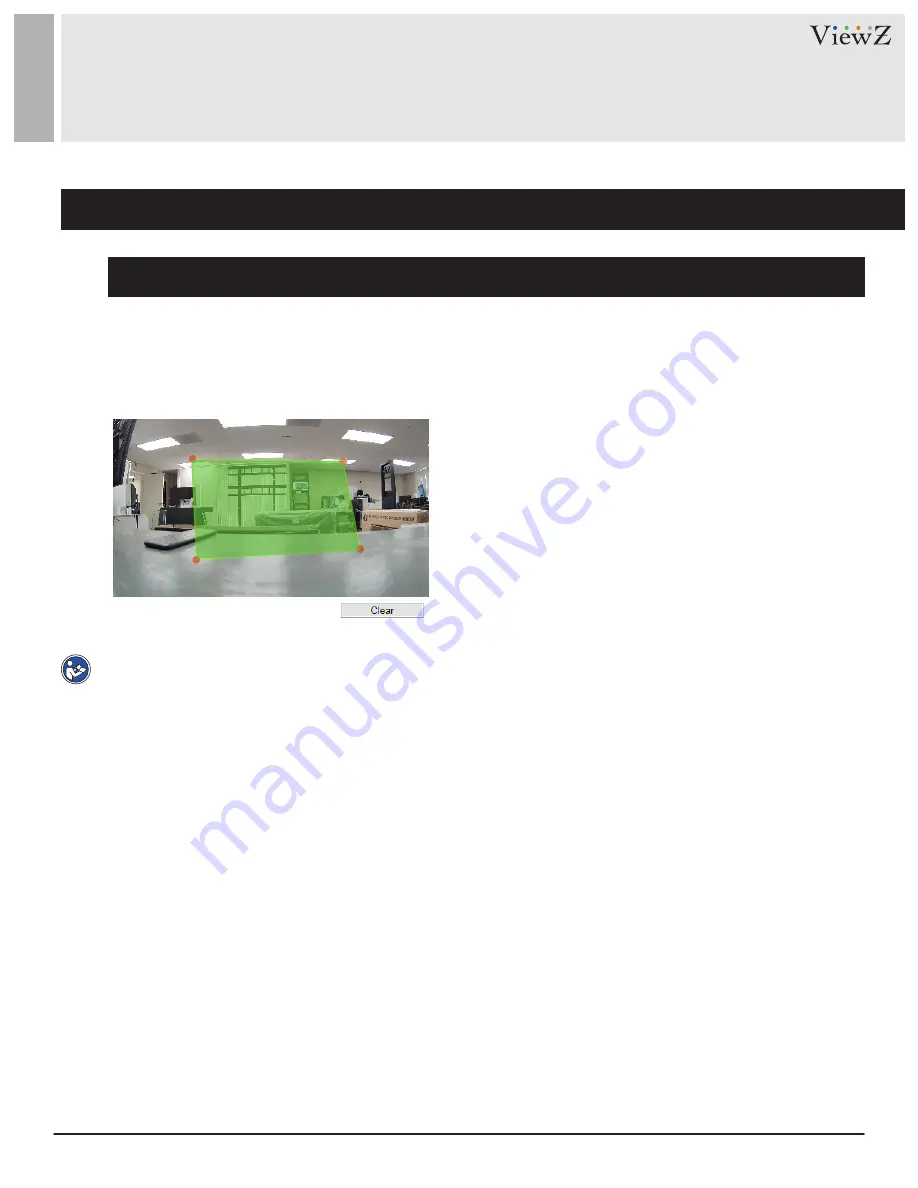
Move the cursor to the drawing interface and click to generate a point, move the cursor to draw a line, and
then click to generate another point. This is how a line is generated. In this way, continue to draw lines to form
any shape, and right-click to finish line drawing, as shown in Figure 6-24.
Figure 6-24 Deployment Area Setting Interface
Note
•
A drawn line cannot cross another one, or the line drawing fails.
•
Any shape with 32 sides at most can be drawn.
•
The quantity of deployment areas is not limited yet and will be described in future when a limit is applied.


