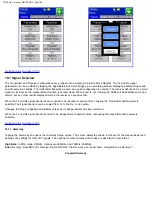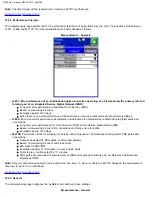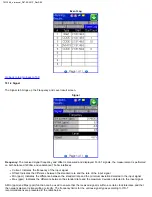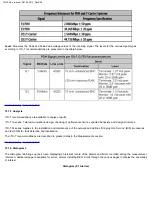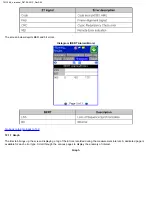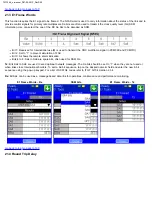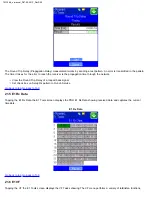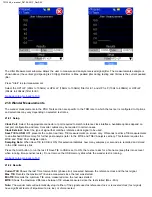
The alarms and errors presented will depend on the signal type and structure selected. A graphical timeline on the horizontal axis
indicates when the event occurred since the test was started. The upper left and right arrows allow the user to scroll through the
measurement period while the + and – keys allow zooming of the time axis. The events presented above are shown in the table
below.
The screen below depicts E1 Errors.
Histogram (E1 Errors)
_e-manual_D07-00-051P_RevD00
Содержание VePal TX130M+
Страница 1: ...TX130M _e manual_D07 00 051P_RevD00...
Страница 19: ...Go back to top Go back to ToC TX130M _e manual_D07 00 051P_RevD00...
Страница 69: ...Go back to top Go back to ToC TX130M _e manual_D07 00 051P_RevD00...
Страница 105: ...Go back to top Go back to ToC TX130M _e manual_D07 00 051P_RevD00...
Страница 171: ...Go back to top Go back to ToC TX130M _e manual_D07 00 051P_RevD00...

