


186
SICAM Q80 7KG8080
Power Quality Recorder SICAM Q80 7KG8080, System manual
E50417-H1076-C420-A2, Release 12.01.2015
Print preview
Click in the menu
Parameter-Set
on
Print preview
.
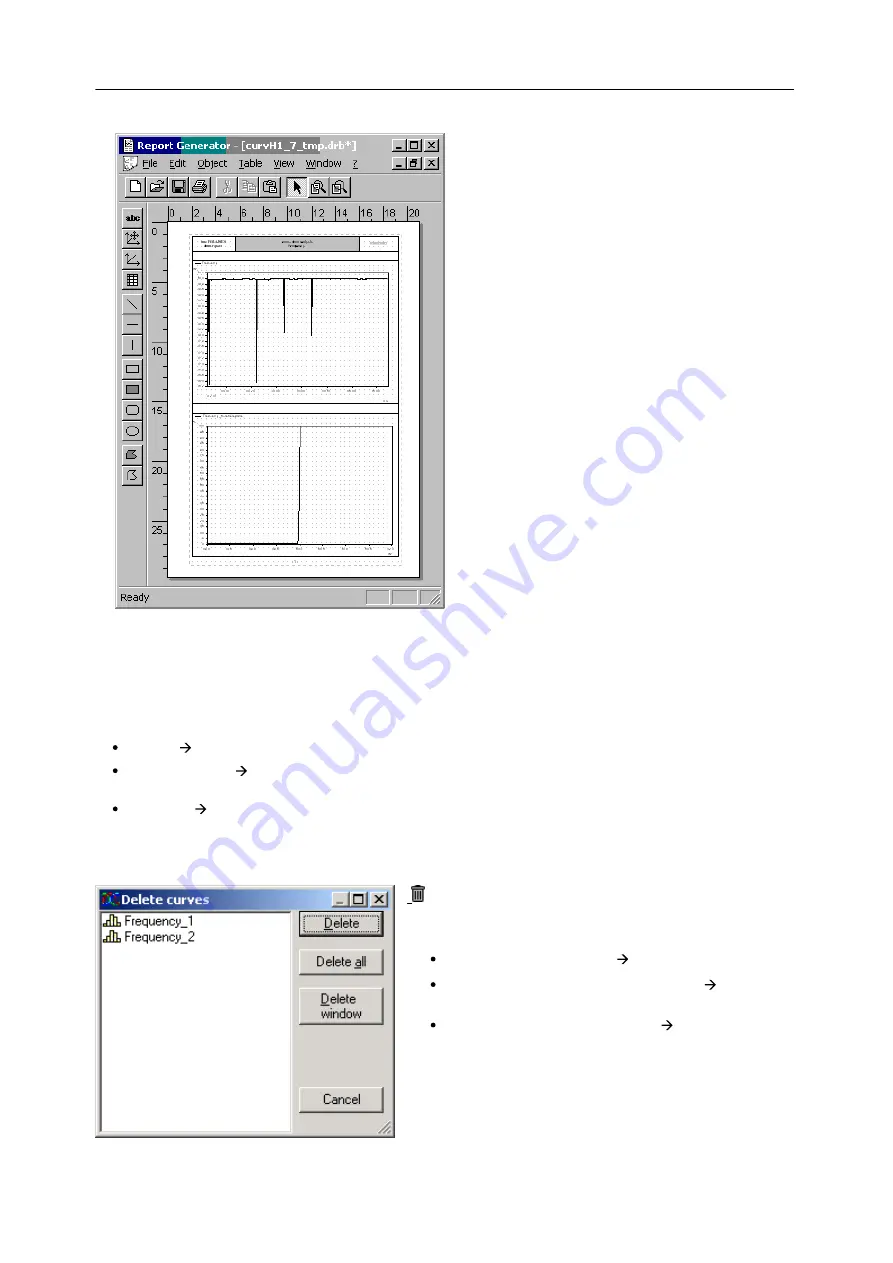
The
Report Generator
, an additional, powerful tool,
opens.
Here you can not only
view
the page, but also move
curves, edit texts or add new elements.
To
, use the Report Generator's menu. There
you will find a "real" page preview.
6.4.5
Working with curve windows
The desired channels can be taken from the list of measurement channels into the curve window by means of
Drag&Drop.
Releasing the data over:
a Y-axis
displays the data with this Y-axis
the curve window
generates a new Y-axis (recommended if voltage and current are to be displayed
simultaneously)
the X-axis
generates a new X-axis (recommended if very many data are already displayed in a window)
Active curve window
Click the mouse on the desired curve window. That curve window then seems to "float" above the others. Any actions
taken then affect this window.
Delete curve window
Click on the trash bin icon in the toolbar. The following actions
then happen to the
active
curve window:
No signals in curve window
Curve window is deleted
Exactly one signal in the curve window
Data set is
removed from curve window
Multiple signals in curve window
A selection dialog
showing all signals contained in the curve window is
shown.