7
MONITORING
82
8021804/2017-11-27|SICK
T R A N S L A T I O N O F T H E O R I G I N A L I N S T R U C T I O N S | Telematic Data Collector
Subject to change without notice
7.2.6
Administering the management platform
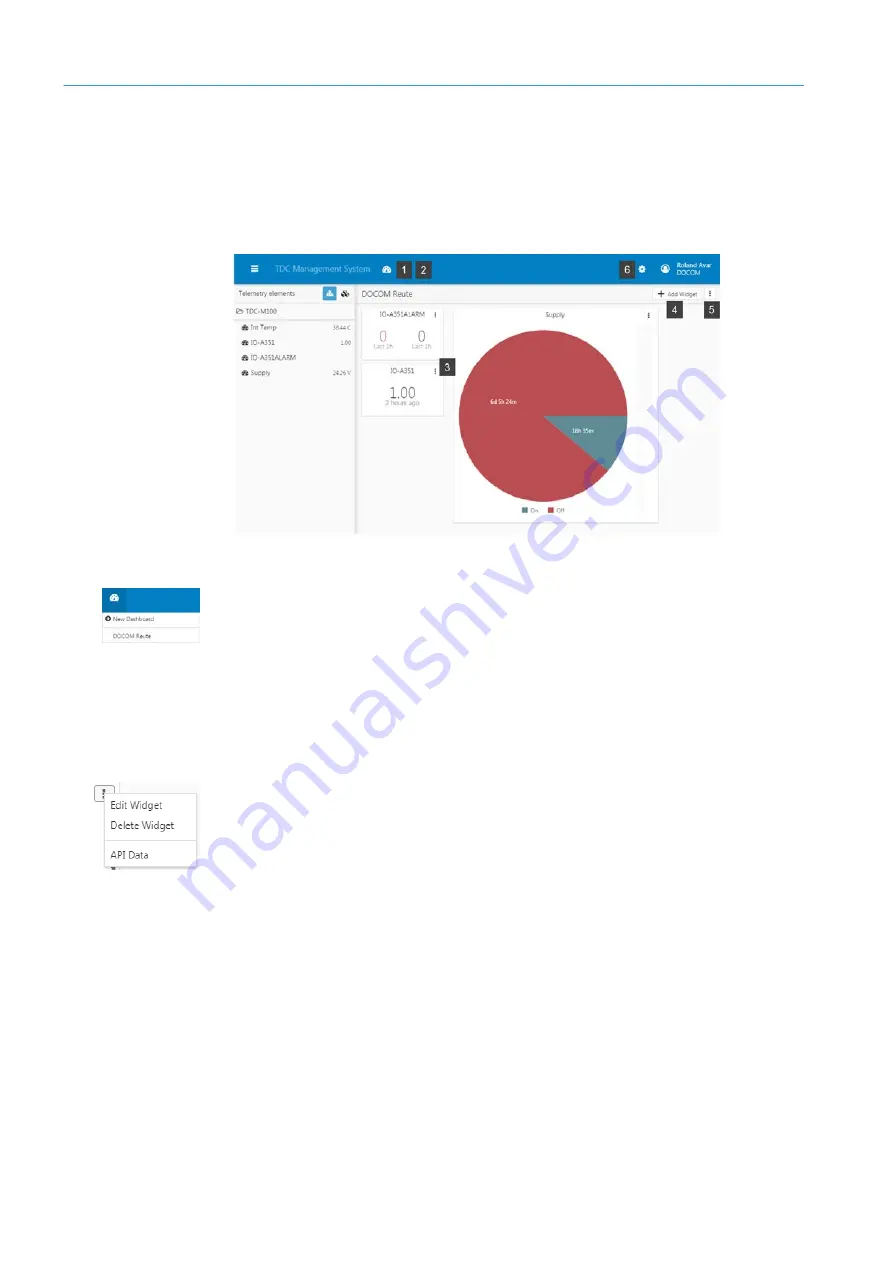
On the TDC Management System, it is possible to create multiple dashboards so your
sensor data can be visualized. More widgets can be added to a dashboard at any point.
Widgets that have already been placed on a dashboard can be edited or deleted. More
TDC devices can also be added.
In this chapter, you will get a brief overview of the editing options available.
1. Adding another dashboard
▸
Click on the speedometer icon in the menu bar and select
New Dashboard
. The
Create
Dashboard
2. Opening a dashboard
▸
Click on the speedometer icon in the menu bar and select the desired dashboard from
the list of dashboards that have been created.
The dashboard will open along with all of its widgets.
3. Editing widgets
Each widget has an edit icon.
•
Click on
Edit Widgets
to open a widget and then change a filter setting or analysis
period, for example.
•
Click on
Delete Widgets
to remove a widget from the dashboard.
Click on
API Data
to view the API call returning the sensor data (refer also to
Transferring data to a customer application using an API interface
4. Adding a widget
▸
Click on
Add Widget
in the menu bar to add another widget to the dashboard.
5. Deleting a dashboard
▸
Click on the edit icon on the dashboard and select the command
Delete Dashboard
.
6. Adding more TDC devices
▸
Click on the gear icon in the menu bar and select the option
Devices
(for further
information on this, refer to Chapter
7.2.2 Registering additional TDC devices
Note


