7
MONITORING
76
8021804/2017-11-27|SICK
T R A N S L A T I O N O F T H E O R I G I N A L I N S T R U C T I O N S | Telematic Data Collector
Subject to change without notice
7.2.4
Visualizing key figures using widgets on the dashboard
Data is visualized on the dashboard in the form of what are known as widgets. Technically
speaking, a widget is a graphics window holding a link to a telemetry element.
Widgets can be positioned anywhere within the window and their size can be adjusted as
desired. Different types of widgets are used for different types of data.
▸
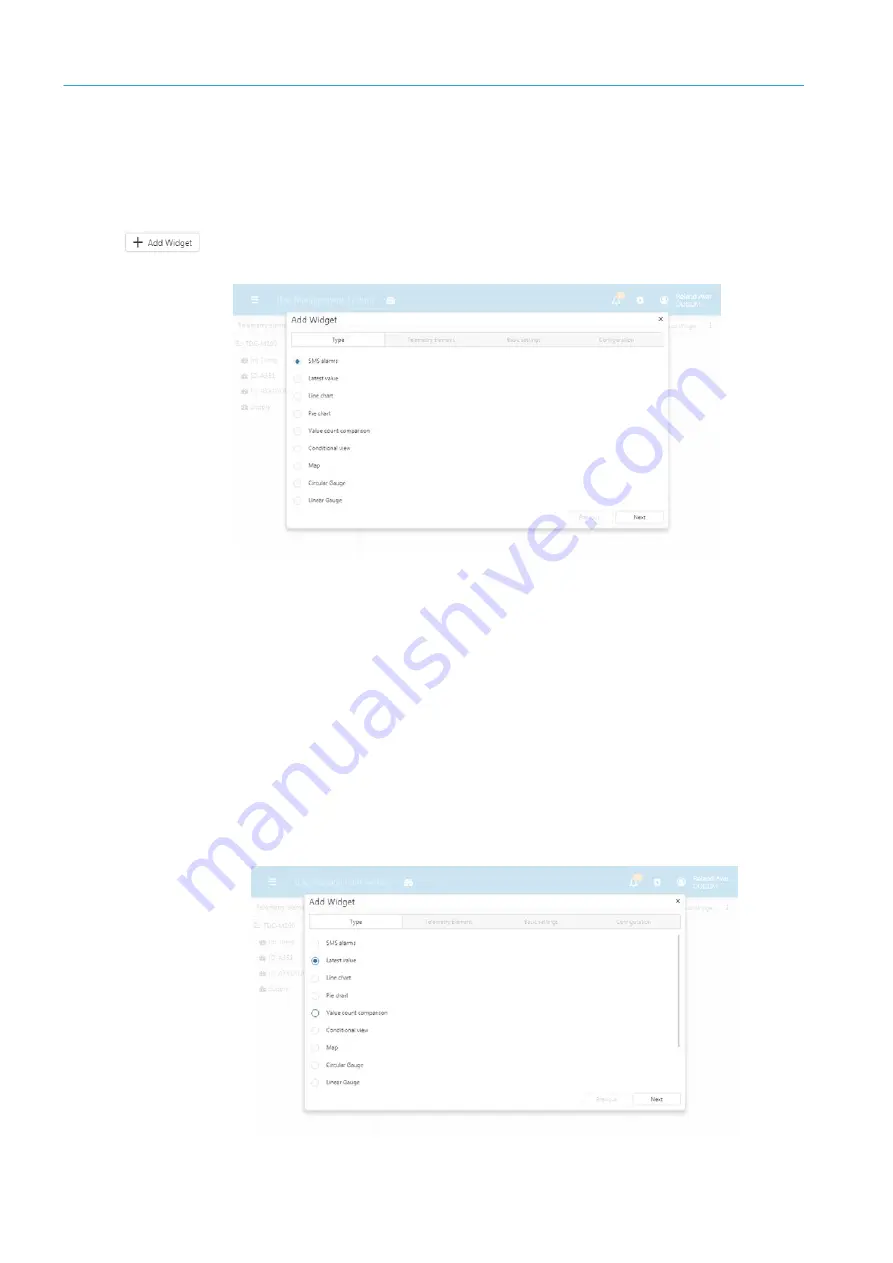
Go to the toolbar on the dashboard and click on
Add Widgets
.
The
Add Widget
window will open.
This window is divided into four tabs, which you will be guided through in the style of a
wizard when you press
Next
.
1. Under the
Type
tab, specify the type of widget.
2. Assign the correct telemetry element under the
Telemetry Element
tab.
3. Enter the name of the widget under the
Basic settings
tab and add a more detailed
description if desired.
4. The details to be provided under the
Configuration
tab depend on the type of widget
selected. Filter settings and analysis time frames can be specified here, for example.
7.2.4.1
Adding key figures for sensor data
A sensor value is visualized in the form of the following widget, which provides a quick
way of checking whether a sensor is working correctly and delivering measurement data.
1. Under the
Type
tab, select
Latest value
as the type of widget.


