33
After opening the Graphics area, click twice on the view [2] to display measures: two vertical lines
will indicate the measurement starting point (start cursor – yellow line), while the green line will
scroll along the diagram to indicate the measurement point currently being read.
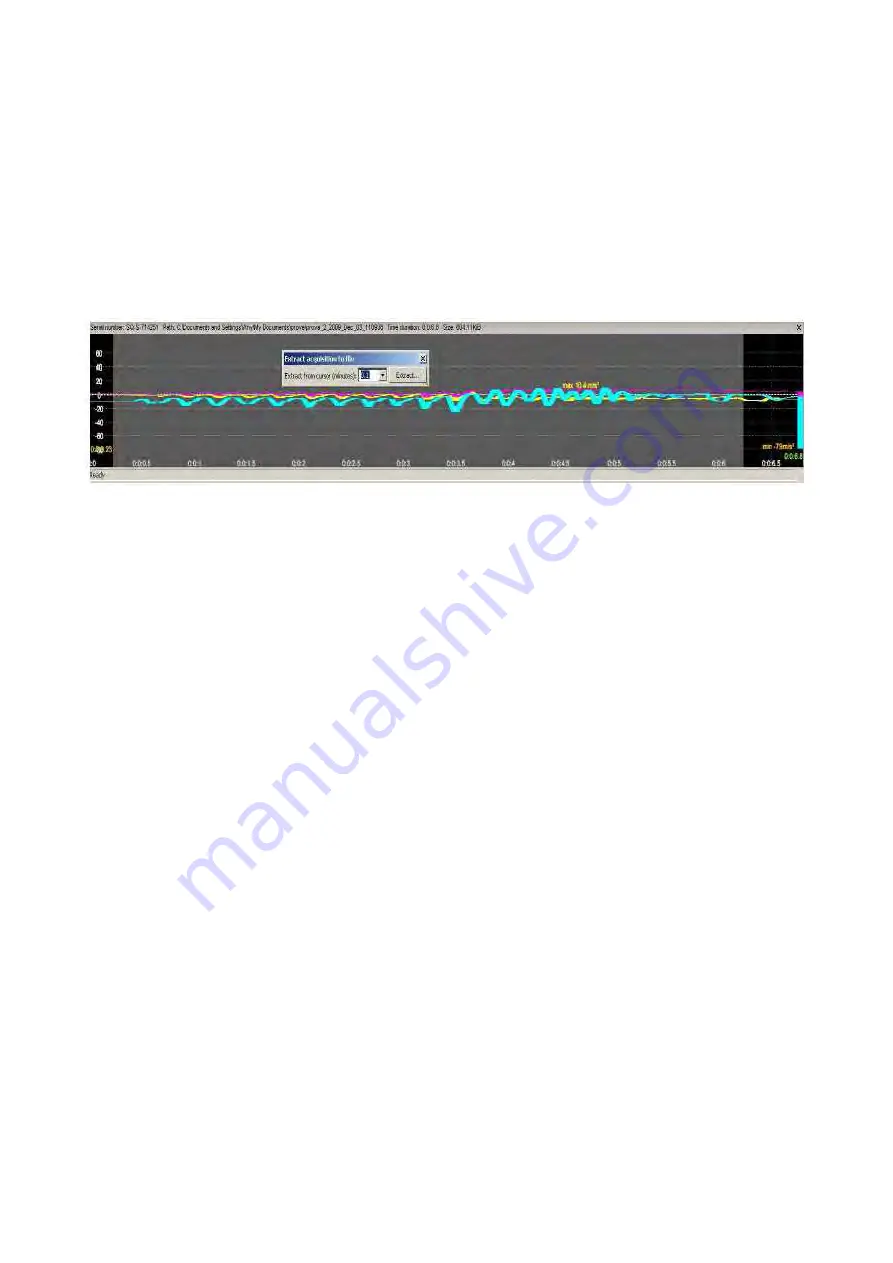
You can also extract to another file some of the measures stored in the File Device and displayed in
the Graphics area [2]. For this purpose, click on the Graphics area [2] by positioning the start
cursor (yellow line) on the starting point of the interval to be extracted, open the pop-up menu by
clicking with the mouse right button on the Graphics area [2] and select Extract to file from
cursor start. The displayed view will indicate the interval minute length of the measure to be
extracted.
FTAnalyzer: extract data from File Device
Please note that if a device has been created and a view has been closed by mistake, it can be
opened again as follows:
View>File Device>File Device name
3.7 Export to text file: measure export
To export measures being acquired or saved to file, click the Hold key to stop scrolling information
in the Graphics area. Click on the diagram and find the starting point so that a vertical bar will be
displayed, then drag the latter up to the point where data shall be exported. Now open the pop-up
menu with the mouse right button and select Export to text file…Please note that data will be
exported consistently with the domain where measures are extracted from. From the pop-up menu
you can also print out the Graphics area or save a file.jpg with the graphics area image. To remove
selection, click Remove Selection…
Содержание FastTracer
Страница 2: ...Printed in February 2010...
Страница 53: ...53 Notes...


