26
FFT Displacement: to display the frequency spectrum of displacement x, y, z
components measured by the acquisition device.
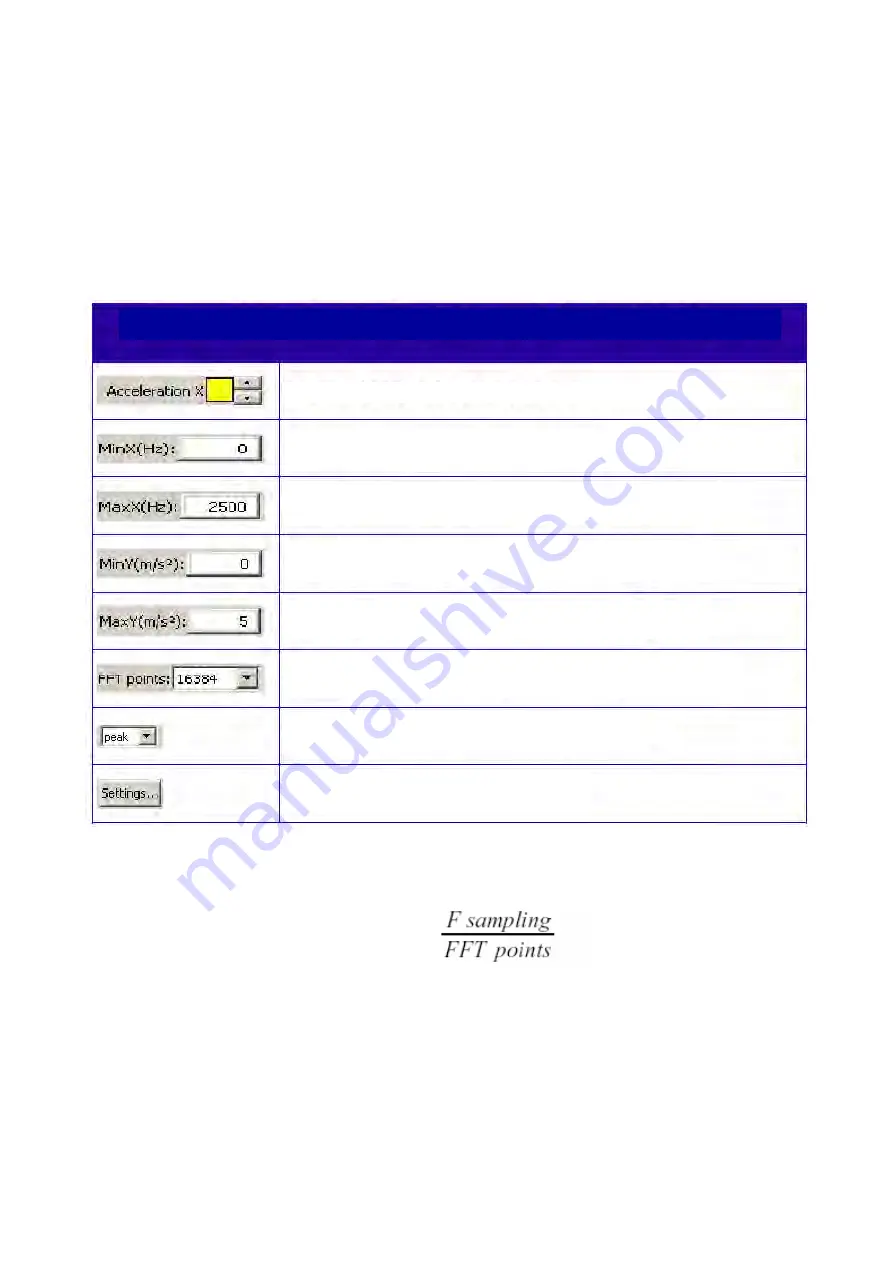
3.5.3 Frequency: display options
The text boxes and buttons below the scroll bar of each Graphics area showing frequency domain
measurements can be used to change display parameters.
The table below provides the different options and related explanation.
The FFT points parameter also provides the frequency resolution, i.e. the number of points (called
samplings) allocated to the frequency field from 0 Hz to 2500 Hz, as follows:
If the user requires a high frequency resolution, a high number of points shall be used, i.e. a high
value of the FFT points parameter. However, the data buffer used for the spectrum calculation shall
include a sampling number twice the FFT points number. As a result, for a high resolution the time
needed to acquire this points number (2 * FFT points) can last a dozen of seconds.
Advanced settings
Y axis value (peak, peak-to-peak, rms)
Number of points used to display the FFT diagram
To set up the maximum value of the diagram Y axis scale
To set up the minimum value of the diagram Y axis scale
To set up the maximum value of the diagram X axis scale
To set up the minimum value of the diagram X axis scale
To highlight the colour of the analysed event
Frequency domain Graphics Area display parameters
Resolution =
Содержание FastTracer
Страница 2: ...Printed in February 2010...
Страница 53: ...53 Notes...


