


User Interface
ESS Inverter User Manual
61
Chart
Home
L
i
Quick Setup Chart
Home
Log
Console
XXXXXXXX
Load consumption capacity
from PV
Battery storage capacity
Feed-in grid capacity
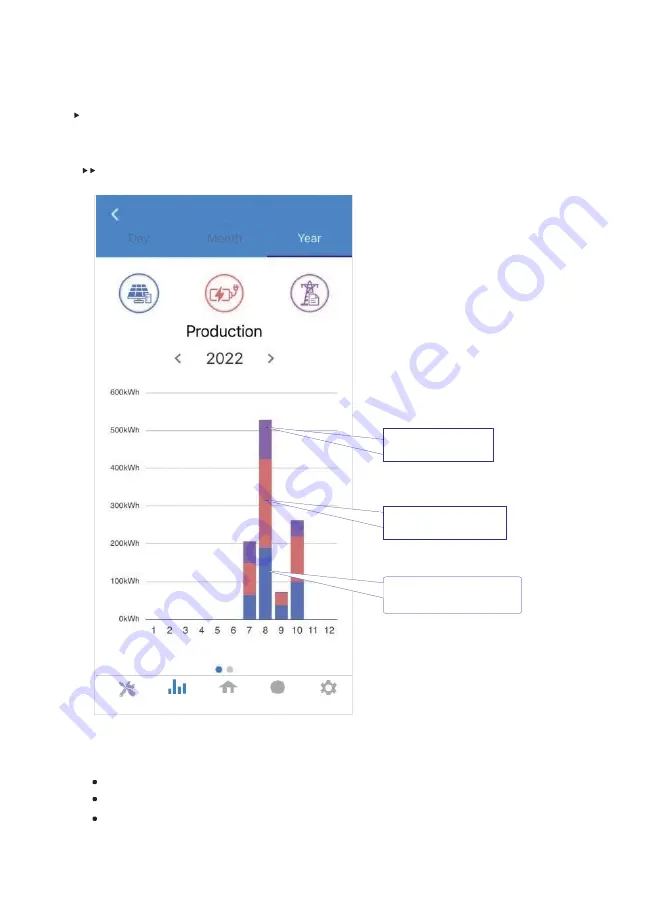
Query (Yearly) Data
Go to
Chart
>
Year
page. It will show the Annually Production or Consumption Curve in
this page. You can swipe the screen left and right to switch the graph.
Year Chart--Production
The above combination year chart shows the distribution of PV production capacity with
three parts:
load consumption capacity (
Blue
)
battery storage capacity (
Red
)
feed-in grid capacity (
Purple
)