10.5 Target Range
Main menu > My data > Target range
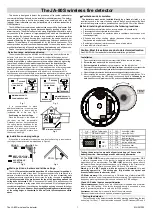
This screen displays a pie chart and a table illustrating your blood
glucose results for the time period and time of test you selected.
The chart is divided into the following blood glucose result
ranges:
Above
,
Within
,
Below
and
Hypo
. Using the
buttons,
you can move backwards or forwards in time within the selected
time period.
1
Time scale
Illustrated time period
2
Selected time of
test
Displays logbook entries entered for
this time of test.
3
Target range chart
Shows the target ranges of blood
glucose results as a pie chart.
4
Percentage
distribution
Shows the percentage of blood
glucose results in each blood
glucose result range.
5
Blood glucose
result ranges
Coloured representation of the
blood glucose result ranges
3
4
5
1
2
211
Target Range
10
man_07866364001_C_en-UK.indb 211
12.10.2018 13:09:41
Содержание Accu-Chek Solo
Страница 1: ...User s Manual Accu Chek Solo micropump system man_07866364001_C_en UK indb 1 12 10 2018 13 07 31 ...
Страница 2: ...man_07866364001_C_en UK indb 2 12 10 2018 13 07 31 ...
Страница 5: ...man_07866364001_C_en UK indb 5 12 10 2018 13 07 32 ...
Страница 44: ...32 Getting to Know the Micropump System man_07866364001_C_en UK indb 32 12 10 2018 13 07 43 ...
Страница 68: ...56 Putting the Diabetes Manager into Operation man_07866364001_C_en UK indb 56 12 10 2018 13 07 58 ...
Страница 276: ...264 Reminders man_07866364001_C_en UK indb 264 12 10 2018 13 10 13 ...
Страница 330: ...318 Messages and Troubleshooting man_07866364001_C_en UK indb 318 12 10 2018 13 10 35 ...