Options and Upgrades
ther the near side of a target or a more reflective surface. Low amplitudes may
be the shadow of a feature or a less-reflective surface. When a series of these
lines are combined and displayed, as the vessel moves along the track, a two-
dimensional image is formed which provides a detailed picture of the bottom
along either side of the vessel.
The sidescan data is output as an array of amplitude values which represent the
amplitudes for each sample cell in the beam from a single ping. The sidescan
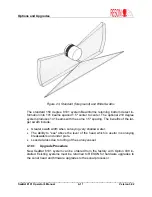
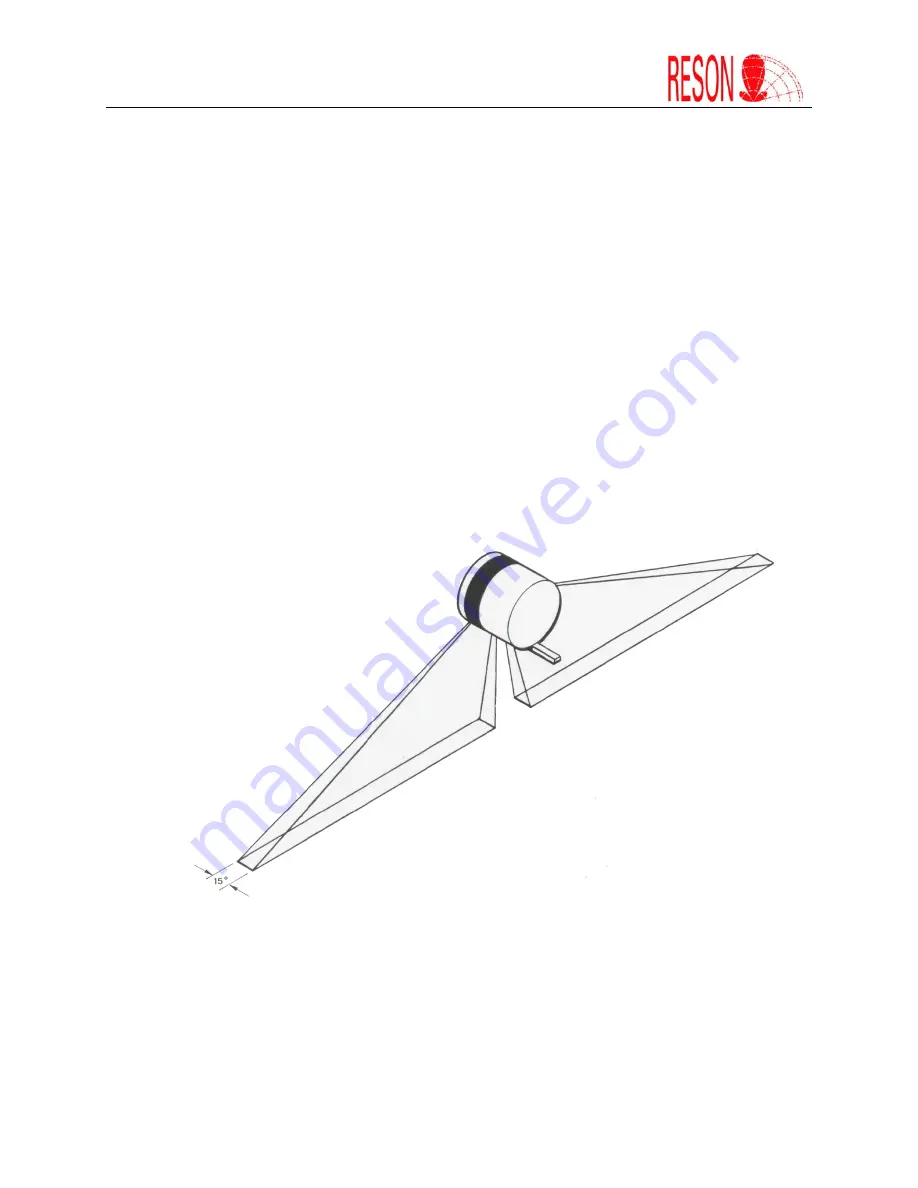
beam (see Figure 19) has the same 1.5º along-track beamwidth as the bathym-
etry beam, but the across- track range resolution is determined by the sampling
rate rather than the beamwidth. The result is that each amplitude value repre-
sents an area 1.5º wide by 5 centimeters. The sidescan beam is designed with a
much wider beamwidth than the bathymetry beams so that each beam has a field
of view from very near the vessel out to the maximum slant range of the sonar.
Once the sidescan data is measured, it is transferred to the sonar processor
where it is processed separately from the bathymetry data to ensure data integ-
rity. The final sidescan data is output from the SeaBat sonar processor via an
Ethernet UDP protocol.
Figure 19, Sidescan Beam Geometry
Sidescan cannot be used to accurately measure depths, but it can provide a
more detailed picture of the sea floor. This image can be used, together with
bathymetry, to identify features and to help ensure that the survey does not miss
any small, but significant targets.
______________________________________________________________________
SeaBat 8101 Operator's Manual
4-5
Version 3.02


