InfiniAM Spectral
40
Operation
The 'Control displayed data' tool (Figure 19) contains a histogram displaying the distribution of pixel
values throughout the whole volume. It may contain multiple peaks corresponding to different regions
of the build, for example, borders may correspond to one peak and bulk hatching to another. If there
are significant anomalies in the build data, these may also give rise to a peak in the histogram.
The 'Control displayed data' tool enables selecting of sub-sets of the data to display. Only the data
range currently covered by the palette slider is rendered in the Volume view. The length of the slider
can be adjusted either by clicking and dragging the ends or by selecting the arrows at either end. The
position of the slider can be adjusted by clicking and dragging in its centre.
•
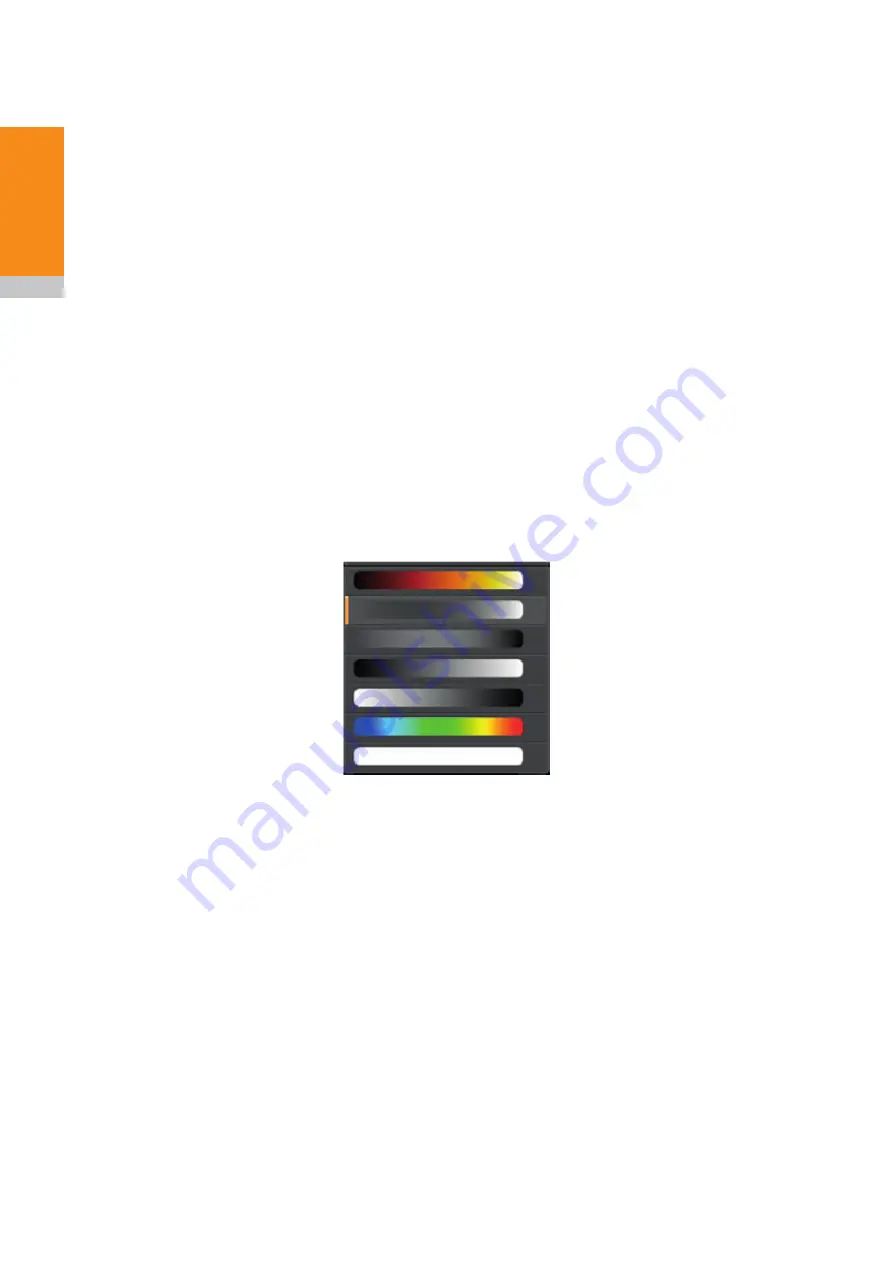
Palette – by changing the palette, the colour scheme used to represent the intensities of the
2D and 3D data can be changed (Figure 20). This is useful for visualising data, according to
personal preference. This colour scheme will be used for both the histogram and 2D/3D data
display. The rainbow palette is useful for inspecting data in 2D that has several distinct peaks
in its histogram. It is less good at highlighting subtle differences in the data. The greyscale
palettes are better at highlighting differences in volumes which have a histogram comprised
of one broad peak. There are two pairs of greyscale palettes: the top two in the list have a
degree of transparency, which is recommended for viewing data in 3D mode. This transparency
enables visualisation of the inside of the volume, not just the edges. When in 2D mode, it is
recommended to use the bottom two greyscale palettes which do not incorporate transparency.
•
Histogram background – the histogram background colour may need to be adjusted depending
on the colour scheme selected. This only affects the histogram view (Figure 21).
•
Out of range – this assigns a colour to the trimmed data. Renishaw recommends using a colour
not used to represent data in the histogram. This only affects histogram view (Figure 21).
Figure 20 Available palettes in the 'Control displayed data' tool
Содержание InfiniAM Spectral
Страница 1: ...InfiniAM Spectral User guide H 5800 3919 01 A...
Страница 6: ...InfiniAM Spectral iv Contents This page is intentionally left blank...
Страница 10: ...InfiniAM Spectral Before you begin 4 This page is intentionally left blank...
Страница 16: ...InfiniAM Spectral 10 Spare parts This page is intentionally left blank...
Страница 18: ...InfiniAM Spectral 12 Contact details This page is intentionally left blank...
Страница 30: ...InfiniAM Spectral 24 Commissioning and decommissioning This page is intentionally left blank...
Страница 62: ...InfiniAM Spectral 56 Operation This page is intentionally left blank...
Страница 64: ...InfiniAM Spectral 58 Troubleshooting This page is intentionally left blank...


