R-sensors LLC
Bldg. 1, 4, Likhachevsky proezd, Dolgoprudny, 141701, Russia
+7 (498) 744-69-95,
NDAS-N. User Manual.
33
To add a signal at the bottom of the window, select the device and channel, if necessary, change the
color of the chart, click the
add
button. To remove the signal, click the cross in the upper right corner of
the signal card. The signal card will appear in the lower part of the window:
Fig. 6.10. RT Viewer module. Signal card
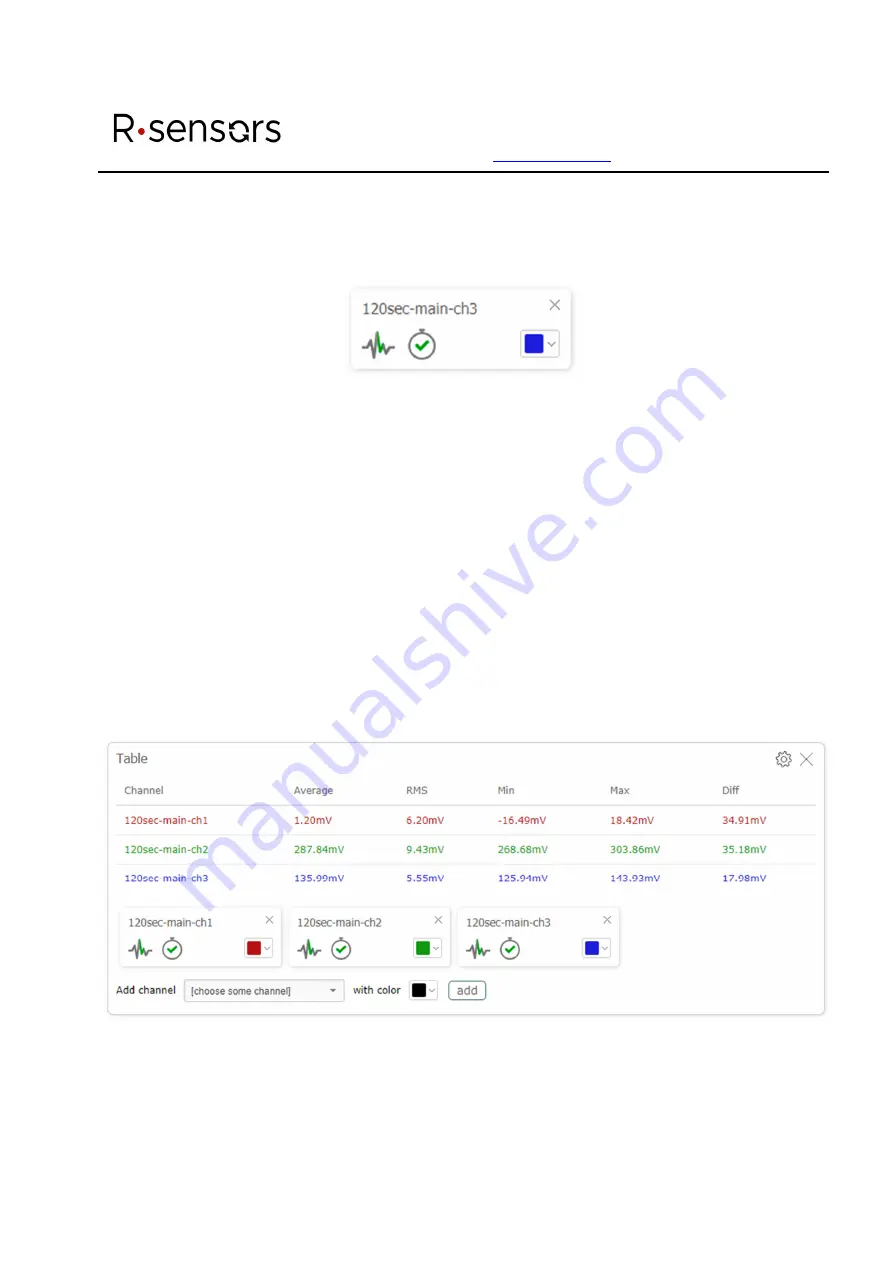
The signal card contains the following information:
The chart icon displays the presence or absence of the data loss during the ‘Time period’ specified
for this window. If the icon is green, there is no data loss for the selected period, if the color is red, there
are breaks in time. Losses will appear as omissions in the waveform chart. It is not possible to make
spectra and calculate table values when there is the data loss.
The stopwatch icon displays the clock status of the signal source. If the icon is green, the source clock
is synchronized. In this case the timestamps sent with the signal will be used as a time reference. If the
icon is red, the source clock is not synchronized, in this case the signal timestamps are ignored and the
browser time is used.
There is also a form for choosing the chart color on the right side of the card.
Fig. 6.11. RT Viewer module. Signal text parameters window


