R-sensors LLC
Bldg. 1, 4, Likhachevsky proezd, Dolgoprudny, 141701, Russia
+7 (498) 744-69-95,
NDAS-N. User Manual.
32
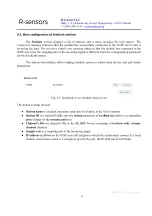
In addition to the general parameters when adding a signal spectrum window, you can set the
following parameters:
●
X-axis scale – X-axis scale, linear or logarithmic
●
Y-axis scale – Y-axis scale is linear, logarithmic or logarithmic in decibels (relative to the 1V
level)
●
Type – chart type meaning spectrum or power spectral density
●
Differentiation – signal differentiation that can be useful while comparing the spectra of
seismometers (velocimeters) and accelerometers
●
Average – averaging of spectra that means the signal section is divided into N equal sections, for
each one the spectrum is calculated, the spectrum generated by averaging all spectra by the points
is displayed
●
Window width – the width of the window
●
Dark background – dark background in the window
6.8. Adding signals to a window
Fig. 6.9. RT Viewer module. Adding a chart to the window


