4-9
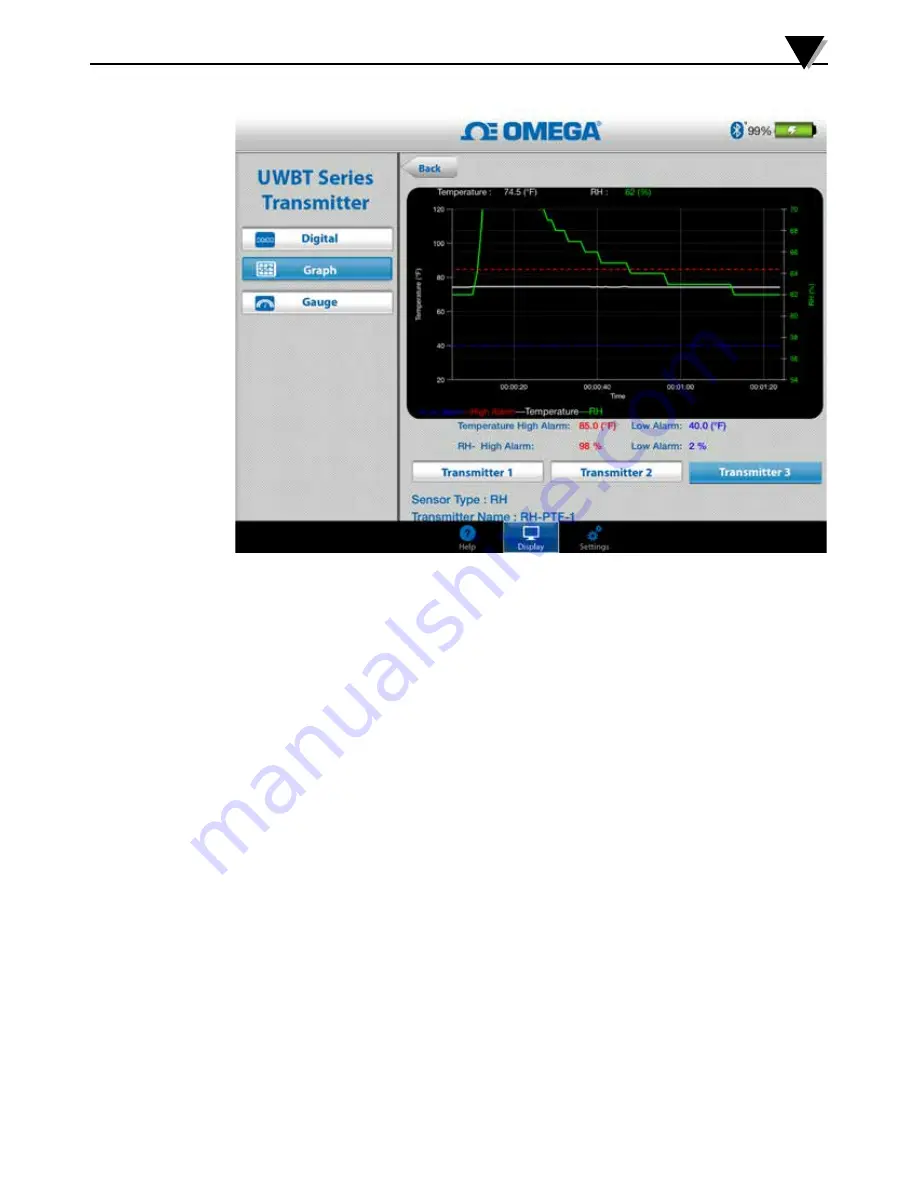
Figure 4-8. Live RH Graph With High And Low Alarms
Playback Graph
The playback graph option allows you to view graph files that have already
been saved to your smart phone/tablet device. These may be files that were
either logged directly to the phone/tablet, or that have been “downloaded from
transmitter” after using internal logging.
After selecting to “Playback Transmitter Data”, you need to select the file you
would like to view. The files you select are named after the Sensor Name + Date
Logging S Time Logging Started.
The playback graph displays all of the data points on one screen. From there,
you can zoom into the graph or zoom back out by pressing on the magnifying
glass symbols in the top right area of the screen. Dragging your finger left and
right anywhere on the graph also allows you to scroll through the timestamps.
The vertical line on the graph is the crosshair; you can drag the crosshair
through the graph for detailed data point information. When resting on a
crosshair, the top of the graph displays the data value and timestamp for that
point.
4-9
Software Instructions (iOS)
4
Содержание UWBT Series
Страница 44: ...4 14 Figure 4 15 Temperature Gauge Figure 4 16 RH And Temperature Gauge 4 14 Software Instructions iOS 4...
Страница 79: ...Figure 5 12 Sample CSV File Figure 5 13 Sample TXT File Software Instructions Android 5 5 10...
Страница 119: ...Figure 6 16 Save All Settings Screen Software Instructions PC App 6 6 17...


