78
5.18.2.
Changing the Graph, Table or Statistics View Header
Each Graph, Table or Statistics tab has a header located above the specific view. The default
headers are:
DataSuite - Graph
DataSuite - Table
DataSuite - Statistics
The header will also be included when printing the graph.
To change the header:
1. Click
Graph Properties
on the graph toolbar.
2. Click the
Style
tab and enter the graph header in the Header field.
5.18.3.
Statistical Analysis
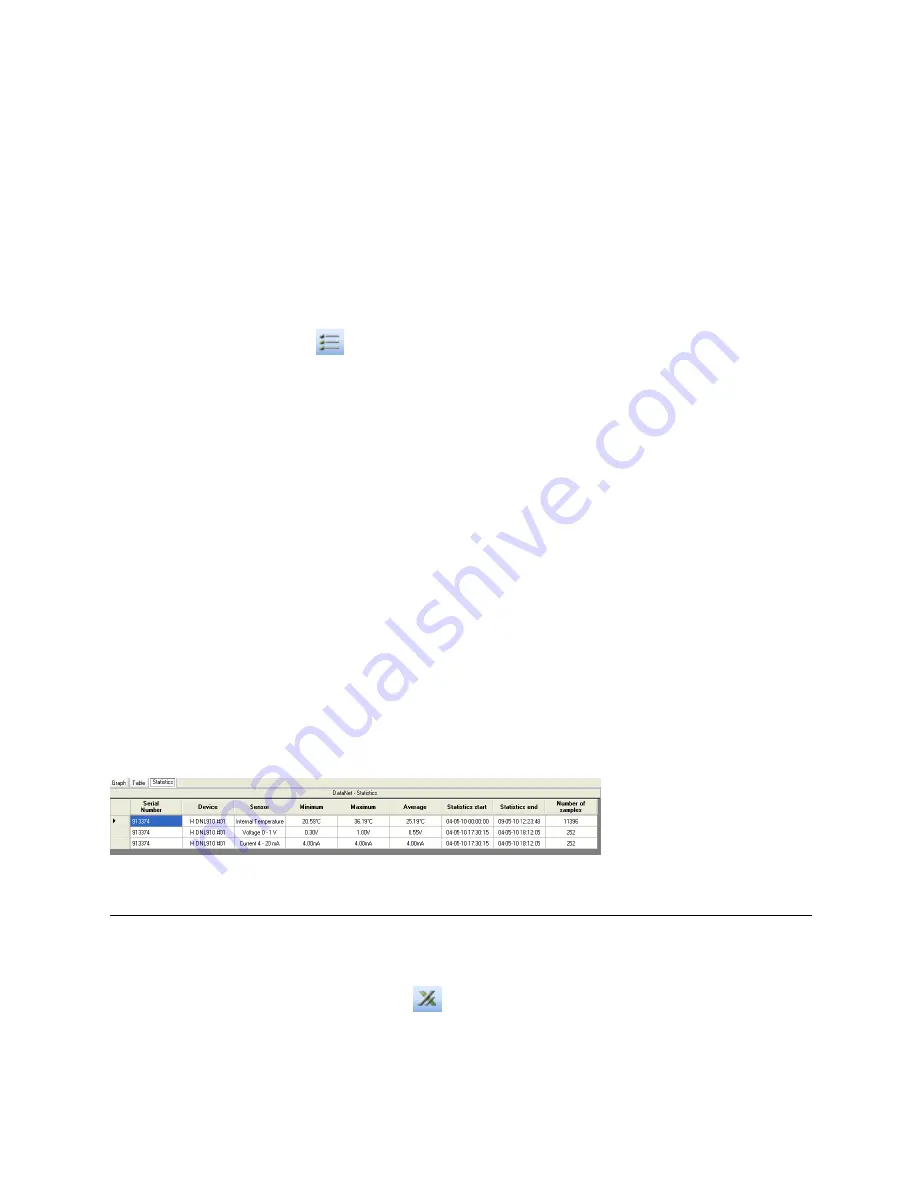
DataSuite also provides some basis statistics regarding the open data sets. While in History
View or online Data Display view, click the
Statistics
tab.
For each of the sensors in the data set, you will have the following statistics displayed:
Minimum / Maximum values
Average value
Number of samples
You will also see the Logger name and SN, as well as the start and end time of the statistics
data range.
While in online mode these statistics are updated in real-time.
If you zoom onto a section of the graph, the statistics are dynamic and will therefore display
statistics of the zoomed graph, not of the whole graph.
If using the cursors, the statistics will be calculated according to the data set between the two
cursors.
Figure 41:
Statistics View
5.19.
Exporting Data to Excel or CSV Formats
DataSuite supports exporting data to Excel or CSV file formats (CSV stands for
comma
separated values
).
To export to Excel, click
Export to Excel
in the online or offline lower graph toolbar, or go
to
Analysis > Export to Excel
(while viewing data in History View). The data currently
displayed on the graph is exported. Data from more than one data logger may be exported
simultaneously.


