Gpredict User Manual
●
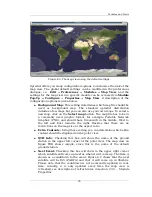
Cursor Position:
If this option is set, the latitude and longitude
corresponding to the position of the mouse pointer will be displayed
in real-time in the lower left corner of the map.
●
Grid Lines:
Enabling this option will draw the grid lines on the map.
The grid lines will be drawn for every 30°.
●
Colours:
These options allow you to change all colours used in the
map view. You can pick a colour using a colour selector by clicking
on the button showing the coloured rectangle. Note that the colours
are specified using their red, green, and blue components and an
additional alpha channel. The alpha channel determines the
transparency of the colour. Colours which are very transparent may
not be clearly visible on the colour picker button as is the case for
the default Axes/Circles colour. Following colours can be set:
○
Ground Station:
This colour is used to draw the small square
and label at the position of the current ground station.
○
Grid:
This colour is used to draw grid on the map.
○
Tick Labels:
The colour used for the tick labels on the grid.
○
Satellite:
The colour of the satellites, their labels, and footprint
circles.
○
Selected Sat.:
The colour of the selected satellite, its label, and
its footprint circle.
○
Ground Track:
The colour used to draw the ground track of a
satellite.
○
Coverage Area:
This colour is used to highlight the area covered
by the footprint of the satellite. It is strongly suggested to make
this colour
very
transparent.
○
Info Text FG:
The foreground colour used for the additional
information, e.g. Next Event.
○
Info Text BG:
The background colour used for the additional
information.
○
Shadow:
Determines how strong the shadow below satellite
markers and labels should be. This shadow is used to enhance the
visibility of the satellites on the map when they are over light-
coloured regions such as the South Pole or a desert area.
●
Display ground track for ___ orbit(s):
This setting specifies for
how many orbits the ground track of a satellite should be displayed.
The default value is 1 and you can choose any value between 1 and
10.
4.2.3 The Polar View
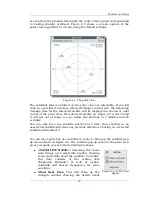
The polar view (also called radar view) shows the satellites within range on
a polar graph. The polar axis represents the azimuth of the satellites
starting at North and turning towards East, while the radial axis represents
to the elevation of the satellites with 90° at the centre, corresponding to
looking straight up in the sky. Thus, the polar view is a projection of the sky
36
Содержание Gpredict 1.2
Страница 1: ...Updated for Gpredict 1 2 by Alexandru Csete OZ9AEC Gpredict User Manual ...
Страница 5: ......

