Chapter 9 User interfaces
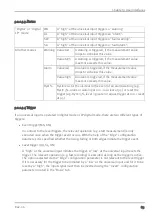
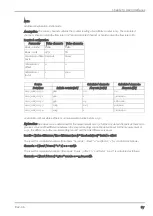
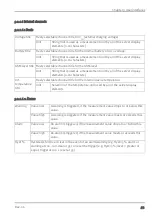
Default report
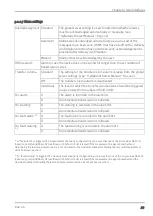
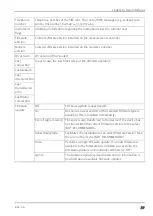
Selection of the report that is loaded by clicking on the device link in the
maps
Off
The default graphic is loaded.
"Name of a
report"
The selected report is loaded.
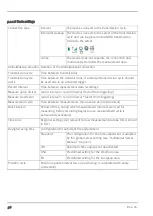
Report template
Selection of whether the default graphic or a report template to display
the data is used when clicking on the symbol to display the measurement
data located in the site/application list
(not assigned)
The default graphic is used to display the
measurement data.
"Name of a report
template"
Name of the report template used to display the
measurement data
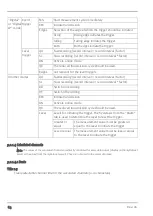
Note:
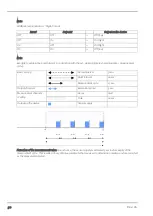
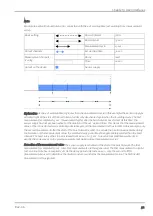
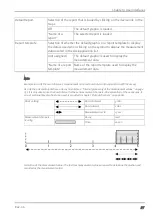
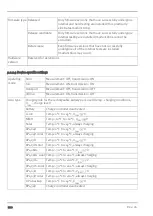
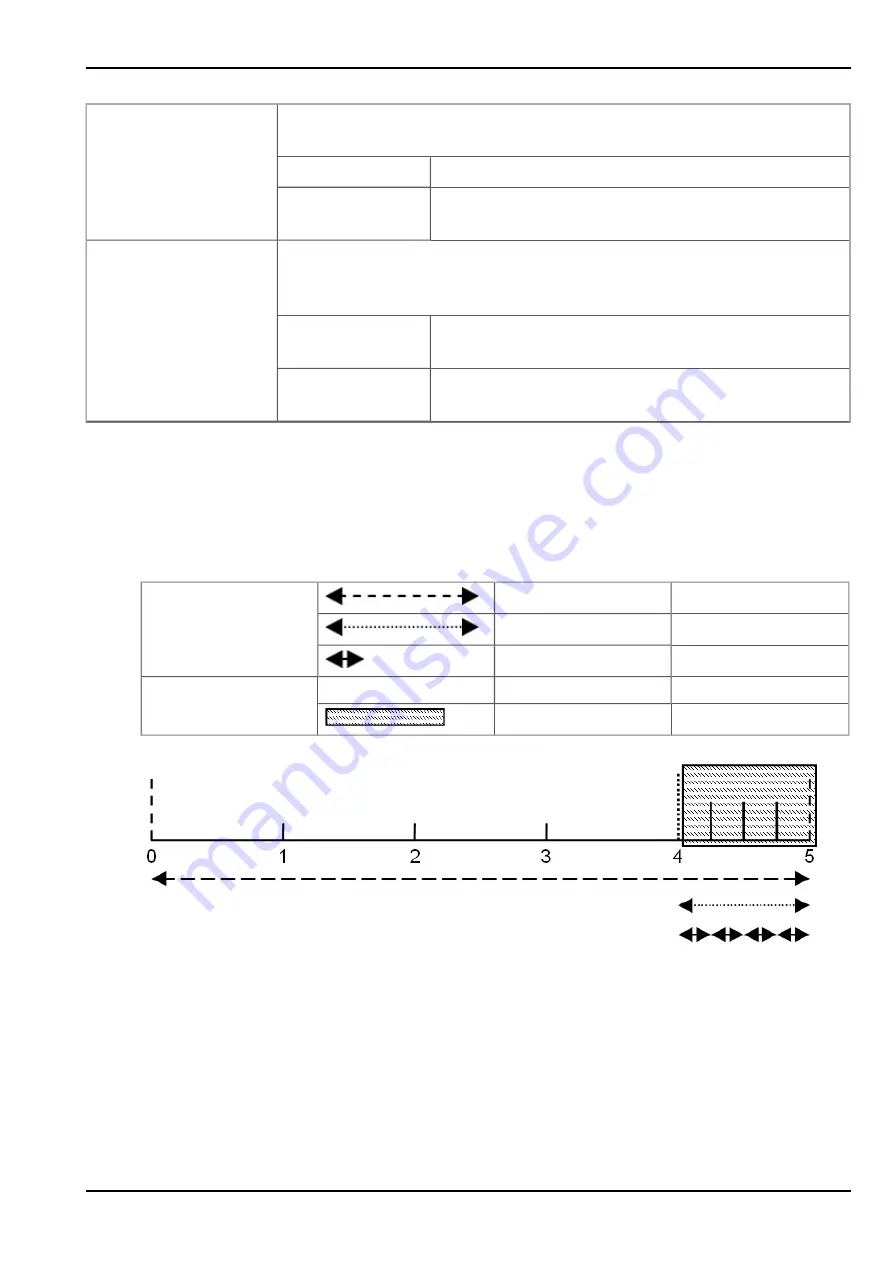
Example to clarify the record interval, measurement cycle and burst interval (in conjunction with the decay)
As only the universal inputs have a decay module (see "Internal processing of the measurement values" on page
25), it is only wise to use the burst interval for these measurement channels. An explanation of the sequences, if
an ext. warmup time also has to be used, is provided in chapter "Output channels" on page 88.
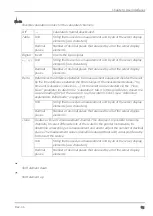
Basic setting
Record interval
5 min.
Burst interval
1 min.
Measurement cycle
15 sec.
Measurement channels -
>Config.
Decay
med
Time
60 sec.
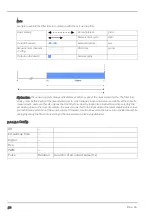
Formation of the measurement value: The last four measurement values are used to determine the median and
recorded as the measurement value.
Rev. 06
97
Содержание myDatalogEASYplus
Страница 2: ......
Страница 8: ...Chapter 18 Contact information 139 8 Rev 06 ...
Страница 9: ...Chapter 2 Declaration of conformity Chapter 2 Declaration of conformity Rev 06 9 ...
Страница 10: ......
Страница 22: ......
Страница 40: ......
Страница 62: ......
Страница 101: ...Chapter 9 User interfaces 9 2 2 4 GPRS SIM tariff Selected SIM tariff Rev 06 101 ...
Страница 102: ......
Страница 110: ......
Страница 112: ......
Страница 118: ......
Страница 120: ......
Страница 136: ......
Страница 138: ......

