


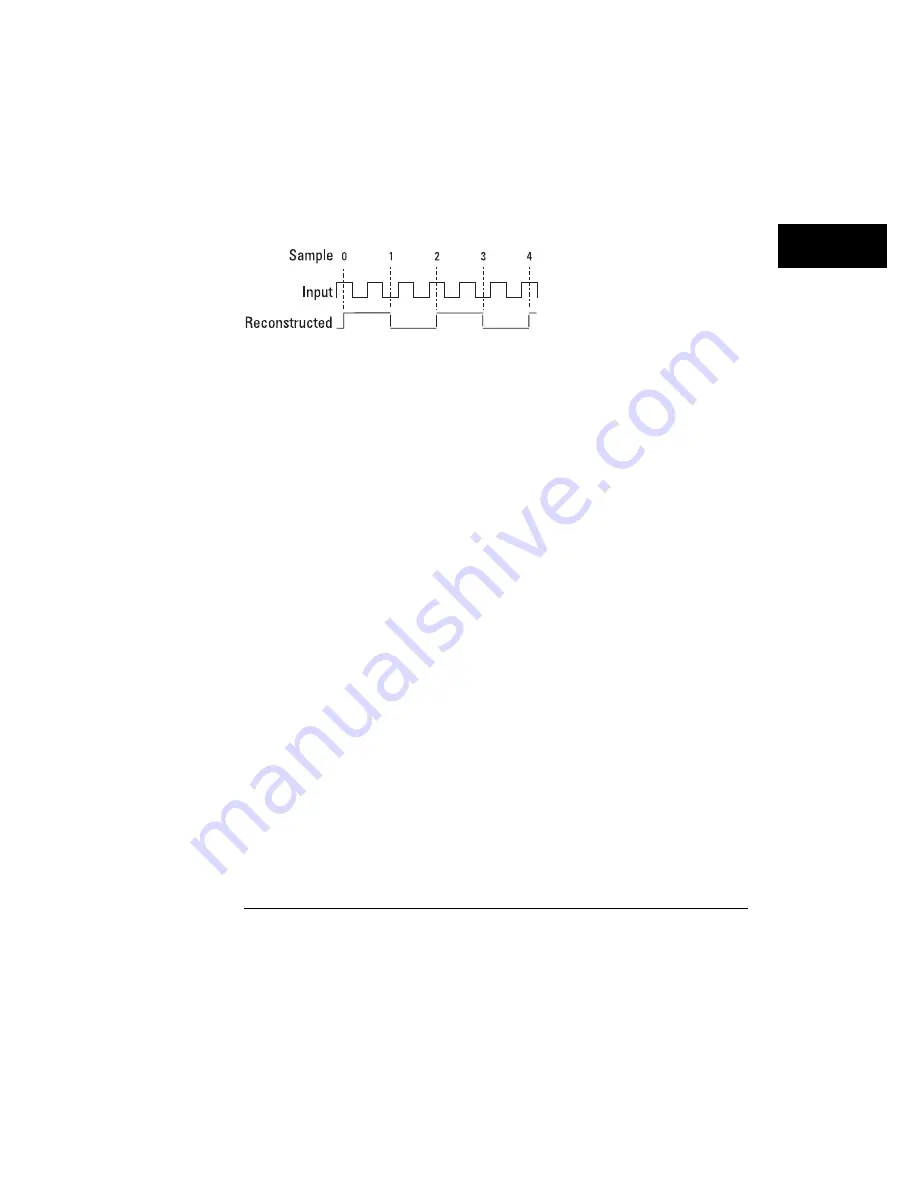
The HP 54620A/C glitch capture circuitry helps prevent aliasing by
identifying additional transitions that occur between samples (for the
HP 54620A/C, this is true when Auto Glitch Detect is on; when it is disabled,
aliasing occurs). Figure 48 shows how the logic analyzer would reconstruct
the waveform from figure 47, given the same sampling rate.
Reconstruction of Waveform with Glitch Capture
Notice that the analyzer identifies the other waveform events, though it
cannot be as precise about the location and duration of those events as it
could be with a faster sampling rate.
Choosing a Time base Setting
Because the Time/Div setting and the sampling rate are related, and because
sampling rate determines the fidelity of reconstruction of the input
waveform, you need to choose a Time/Div setting that will best represent the
events on the input waveform. Usually, you will start with a setting that
represents all the inputs you want to examine simultaneously. You can then
examine the display and decide whether the sweep speed should be
increased, based on the following:
•
If the sampling rate is too slow compared to the number of waveform
transitions, the display will show several glitches. You need to increase the
sweep speed by at least a factor of two.
•
If the sampling rate is much too slow compared to the number of
waveform transitions, the displayed waveform will be a white bar. You
need to increase the sweep speed by a factor of four to ten.
Figure 49 shows a waveform display with the main sweep as a solid bar,
indicating that the sampling rate is too slow. The delayed sweep in the same
display shows several glitches. Note the disjoint edges on other pulses,
indicating that the analyzer detected the waveform to be in a different state
after a glitch occurred.
Figure 48
Ensuring Accurate Measurements
Glitch Detection
145
Содержание 54620A
Страница 7: ...6 ...
Страница 13: ...12 ...
Страница 17: ...16 ...
Страница 18: ...1 Getting Started ...
Страница 20: ...Using the Logic Analyzer Figure 1 Getting Started 19 ...
Страница 52: ...2 Making Analyzer Measurements ...
Страница 121: ...120 ...
Страница 122: ...3 Solving Problems ...
Страница 127: ...126 ...
Страница 128: ...4 Ensuring Accurate Measurements ...
Страница 150: ...5 Testing Adjusting and Troubleshooting the Analyzer ...
Страница 180: ...6 Replaceable Parts ...
Страница 193: ...Exploded View of Logic Analyzer Figure 60 Replaceable Parts To order a replacement part 192 ...
Страница 196: ...7 Performance Characteristics ...
Страница 208: ...8 Messages ...
Страница 217: ...216 ...
Страница 239: ......
Страница 241: ...240 ...