


97
Decimal, Integer & Trig
The next option of
Decimal
resets the scales
so that each pixel (dot on the screen) is exactly
0
.
1. The result is an X scale of
6 5
6 5
x
− ⋅ ≤ ≤ ⋅
and a Y scale of
3 1
3 2
y
− ⋅ ≤ ≤ ⋅
. This may not
give the best view of the function. Personally I
don’t often use it, as it is generally easier to go
to the
PLOT SETUP
view and press
SHIFT CLEAR
.
The
Integer
option is similar to decimal, except
that it sets the axes so that each pixel is 1
rather than 0.1 thus giving an X scale of
65
65
X
− ≤
≤
.
The usual result of this is rather horrible.
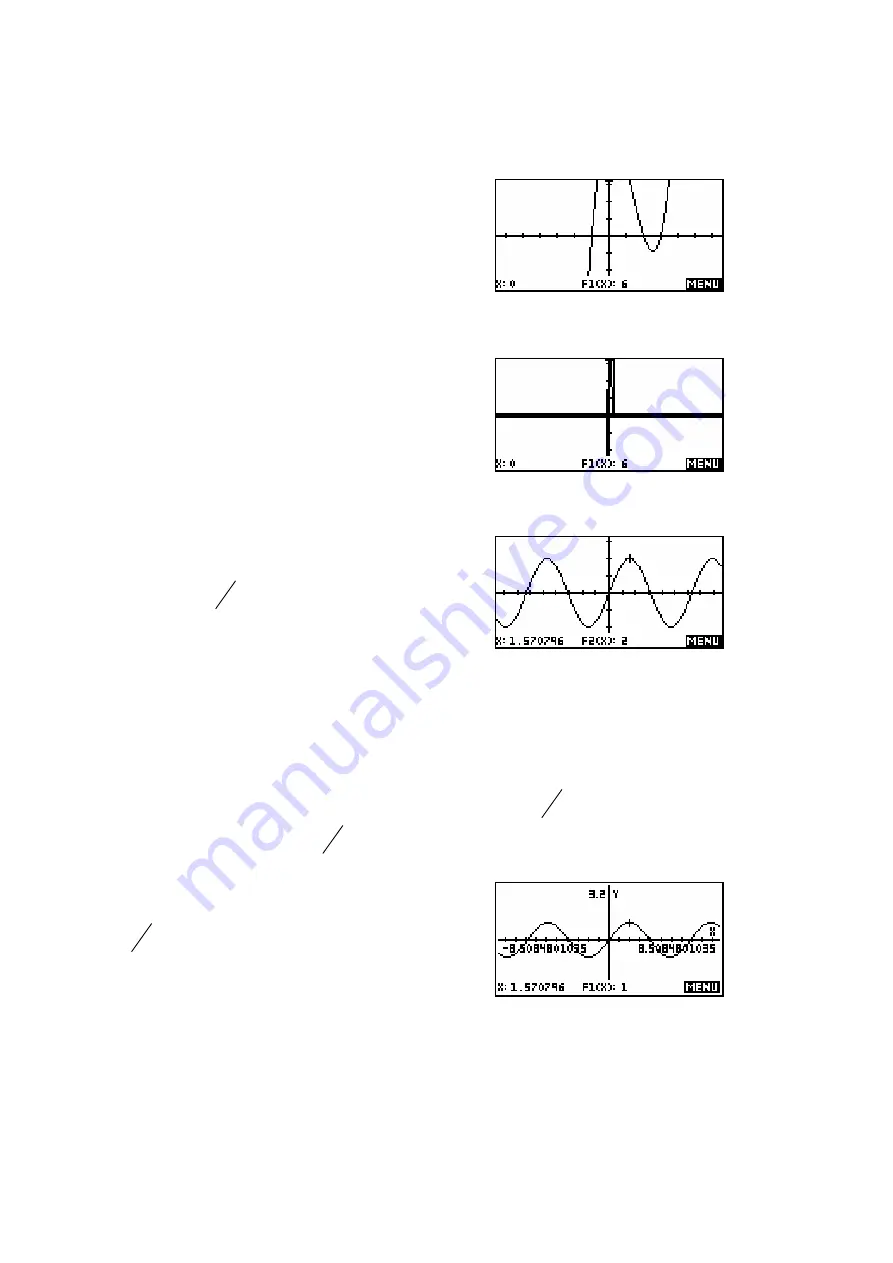
The final option of
Trig
is designed for
graphing trig functions. It sets the scale so
each pixel is
24
π
. This means that if you
were graphing
1( )
2sin( )
F X
X
=
then 24
presses of the left or right arrows would move
you through exactly
π
and the value would be exactly 2 instead of a horrible
decimal.
If you zoom in or out from this, the jumps will still stay relatively nice,
particularly since 24 has so many factors. For example, with a zoom factor of
2, zooming out once would mean each pixel was now
48
π
, while zooming in
would give a pixel jump of
12
π
.
As you can see, the cursor is nicely at a value
of
2
π
, giving a y value of exactly 1 instead of
only very close.


