


133
Move the highlight into column
C1
and enter
the x
i
values, pressing the
ENTER
key after
each one. Now do the same for the y
i
values
in
C2
.
Entering data as ordered pairs
Looking at the bottom of the screen you will see a series of tools provided for
you. As before,
is not worth bothering with.
Calculator Tip
You can enter the x
i
and y
i
data into both columns
simultaneously if you enter it as ordered pairs in brackets.
i.e. as ( 1 , 5 )
ENTER
( 3 , 10 )
ENTER
etc.
In fact, you can even leave off the closing bracket! The
calculator will complete it for you.
We could use
VIEWS
and
Auto Scale
to
produce a plot (this generally produces very
satisfactory results), but let's have a look at the
PLOT SETUP
screen instead.
Adjusting the symbols used to plot points
As you can see, it is very similar to the other
PLOT
SETUP
screens that we
have encountered with the main difference consisting of the list of settings for
S1MARK
,
S2MARK
etc. These are the markings that are to be used in plotting
the points, allowing you to choose different markings for different data sets if
you are graphing multiple data sets.
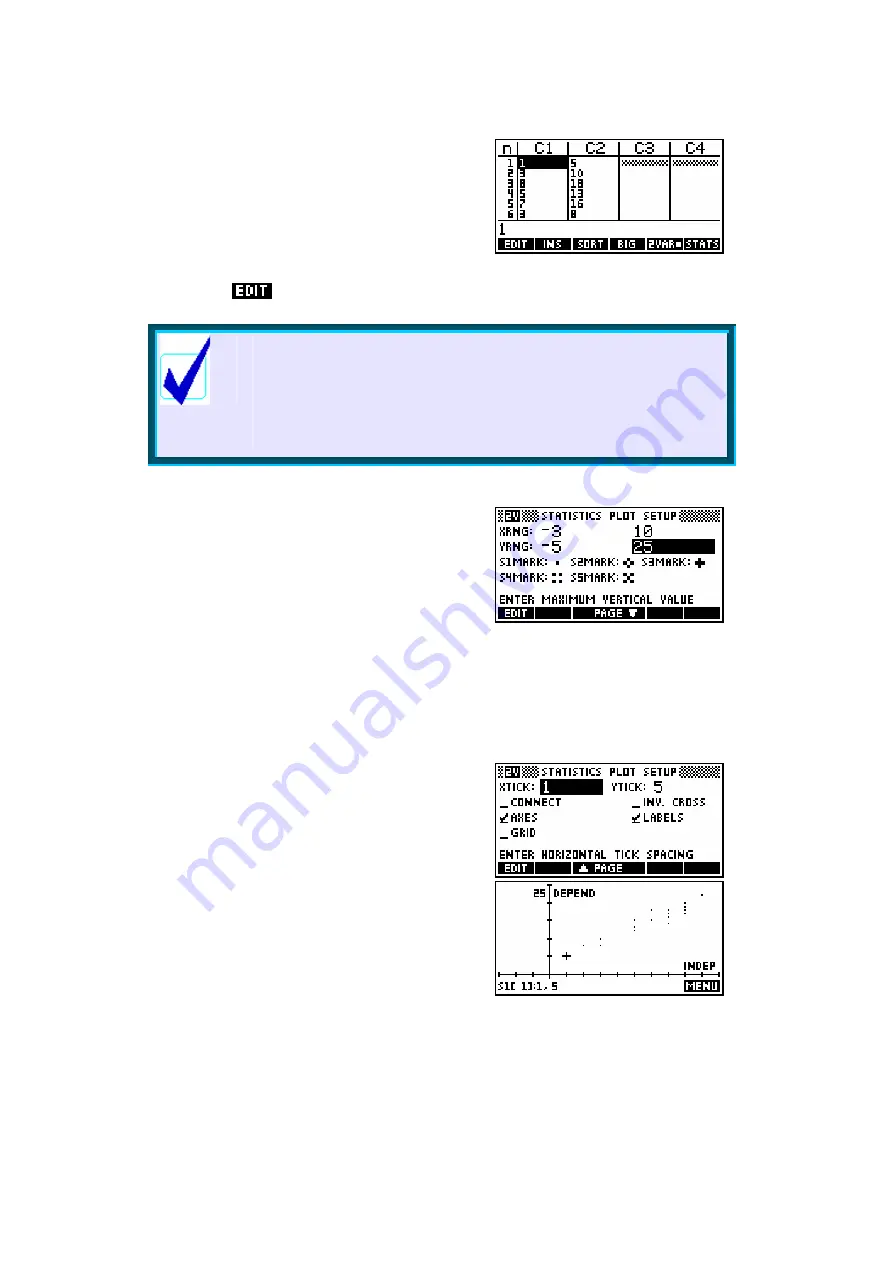
Set your
PLOT SETUP
screen so that it looks
like the one shown above right, also switching
to the second page and ensuring that it is
checked as shown right and setting
YTick
to 5.
The cursor
If you now press
PLOT
you will see the result
shown right. If you look at the screen you will
see a small cross and, at the bottom of the
screen, a listing of
S1[1]: 1,5
. This is
telling you that the cross is currently on the first
point in data set
S1
whose value is (1,5). Using the left/right arrow keys you
can move this cross through the data set with the values being reported at
the bottom of the screen.


