7 Temperature Graph
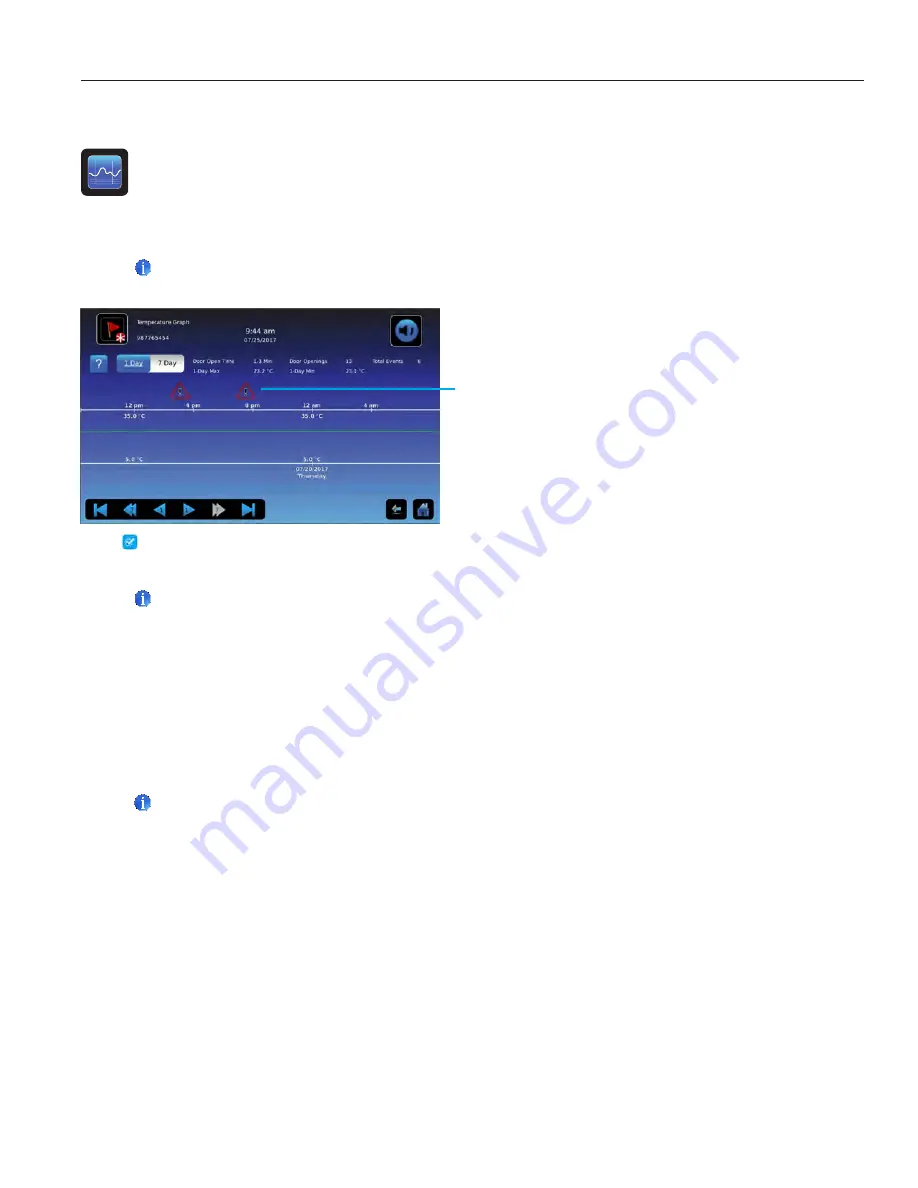
The Temperature Graph screen shows current and historical primary monitor probe temperature data and temperature
events.
Note
Up to 62 days of temperature data can be viewed on the graph.
Viewing the Temperature Graph
1.
Toggle the graph
Time Span
button to select a 1-day or 7-day time span.
Note
To view all graph features (including Alarm Condition and Alarm Test indicators), select the 1-day time span.
Date, day and time information for the selected time span is displayed on the graph line.
•
Upper line represents high alarm limit
•
Lower line represents low alarm limit
•
Temperature graph line turns green when unit is within alarm limits and red when outside alarm limits
•
Graph is displayed in strip chart form. A black, dashed vertical line appears on the graph where there is a change
in the date or time. A white, dashed vertical line appears on the graph where there is a change in the high alarm
limit or low alarm limit. A gray, dashed vertical line appears on the graph where the unit is powered on.
Notes
•
If the time or date are changed, the stored temperature data will not be reformatted with the new time configuration.
Logged events may be duplicated in the downloaded event database if the time or date is changed.
•
The temperature graph displays 62 days of data.
•
If the high alarm limit or low alarm limit are changed, a dashed vertical black line will appear on the temperature graph,
corresponding to date and time when the change was made.
Alarm Condition Icon
Helmer Scientific
i.C
3
User Guide for i.Series Incubators
360406/A
12


