46
4.
Manually Picking Data Points
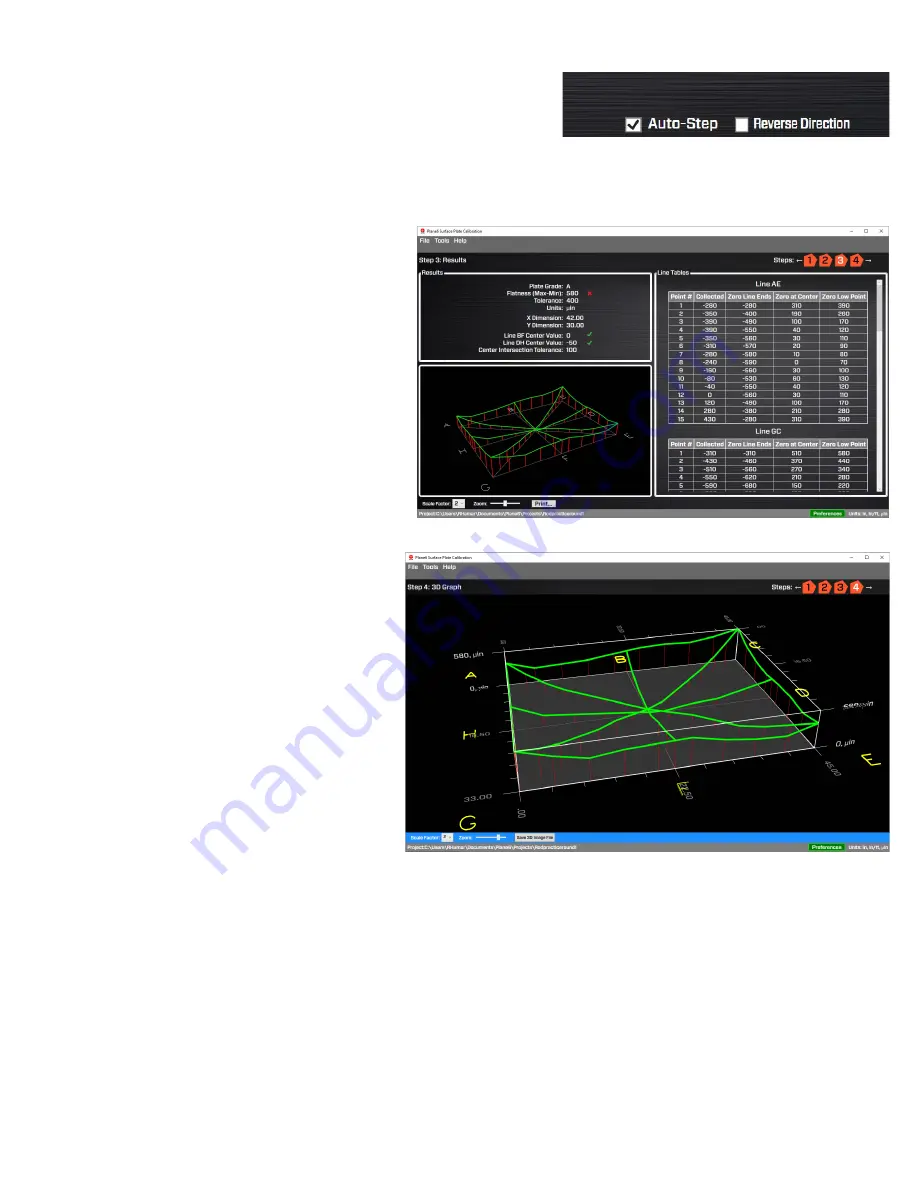
- You can turn
off
Auto Step
if you want to move the target
icon manually.
5.
Reversing Direction on a Line Segment
-
You can also hit
Reverse Direction
to change
the direction of a line if you need to.
Step 9 – Review Results in Step 3 Results
Now click on Step 3 to view the results. The plate
grade is shown, the tolerance for that grade and the
overall flatness results from the data. A green
check mark or red X tells whether it’s in or out of
tolerance.
There is also an additional check for the center
point elevation difference as is directed in the B89
Standard. The tolerance is also displayed.
Plane 6 also displays the data tables for each line
segment. This is all displayed in the report.
Step 10 – Review Graphical Results in Step 4 3D
Graph
You can go to Step 4 3D Graph to look at an
adjustable 3d graph of the results. You can zoom
in/out and rotate the view to see the results. You
can also magnify the elevation change to better
show the results.
Содержание L-703SP
Страница 1: ......
Страница 54: ...50 An example on how to do the Math to get the exact flatness values...
Страница 55: ...51 Plane6 Sample Report...


