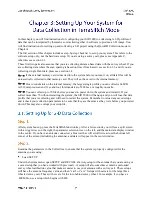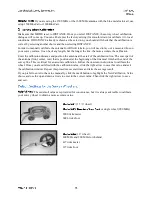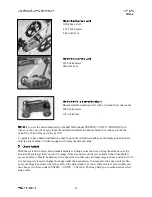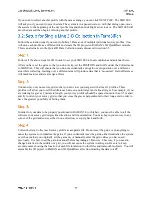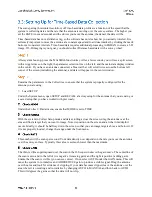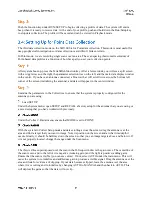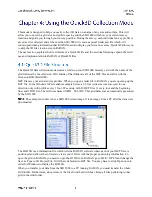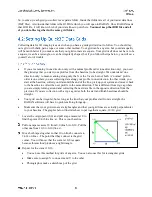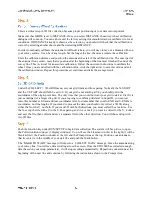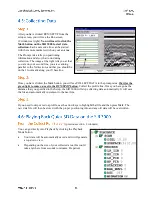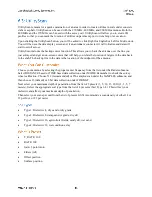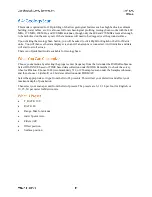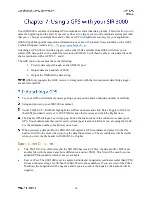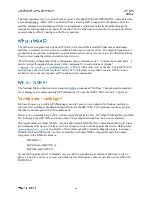
(3 windows with the parameter selection tree at the left)
Click the Playback Mode button. You will see a pop-up window with all of the stored data.
Choose the grid file you want to play back and click the Right arrow. The data will scroll across the
screen.
You can change the Display Gain setting (OUTPUT > DISPLAY > GAIN) or any of the process
settings, including toggling the Migration on and off and selecting the proper material dielectric
for that migration.
A table of dielectrics of common materials can be found in Appendix D.
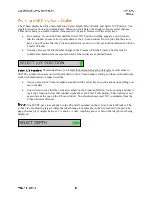
When you have made the necessary changes, click Run/Setup to go to Playback Run. The SIR 3000
will generate the top-down view of your area.
Depending on the size of your collected area, this could take anywhere from seconds to minutes.
Be patient.
The SIR 3000 will also process the data by applying a background removal filter to take out constant
horizontal banding (including the direct wave). If you have the Migration process turned on under the
PLAYBACK > PROCESS menu, then the computer migrates with the dielectric that you have specified
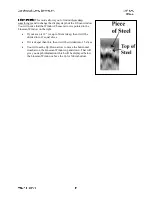
under PLAYBACK > SCAN. Just like under the Test_Diel function in Collect Setup, if you have too low
a dielectric specified, the hyperbolas will turn into ‘smiles.’ If you have too high a number, they will
remain hyperbolas.
The SIR 3000 is only performing a constant velocity migration.
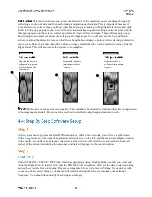
Once you get to this display you can toggle to different color tables or transforms by using the Command
Bar buttons, or go back to the Setup (3 windows) screen by clicking Run/Setup.
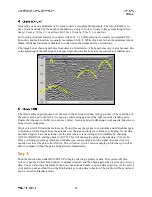
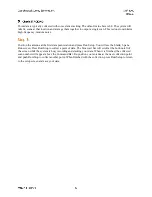
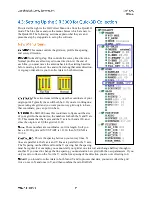
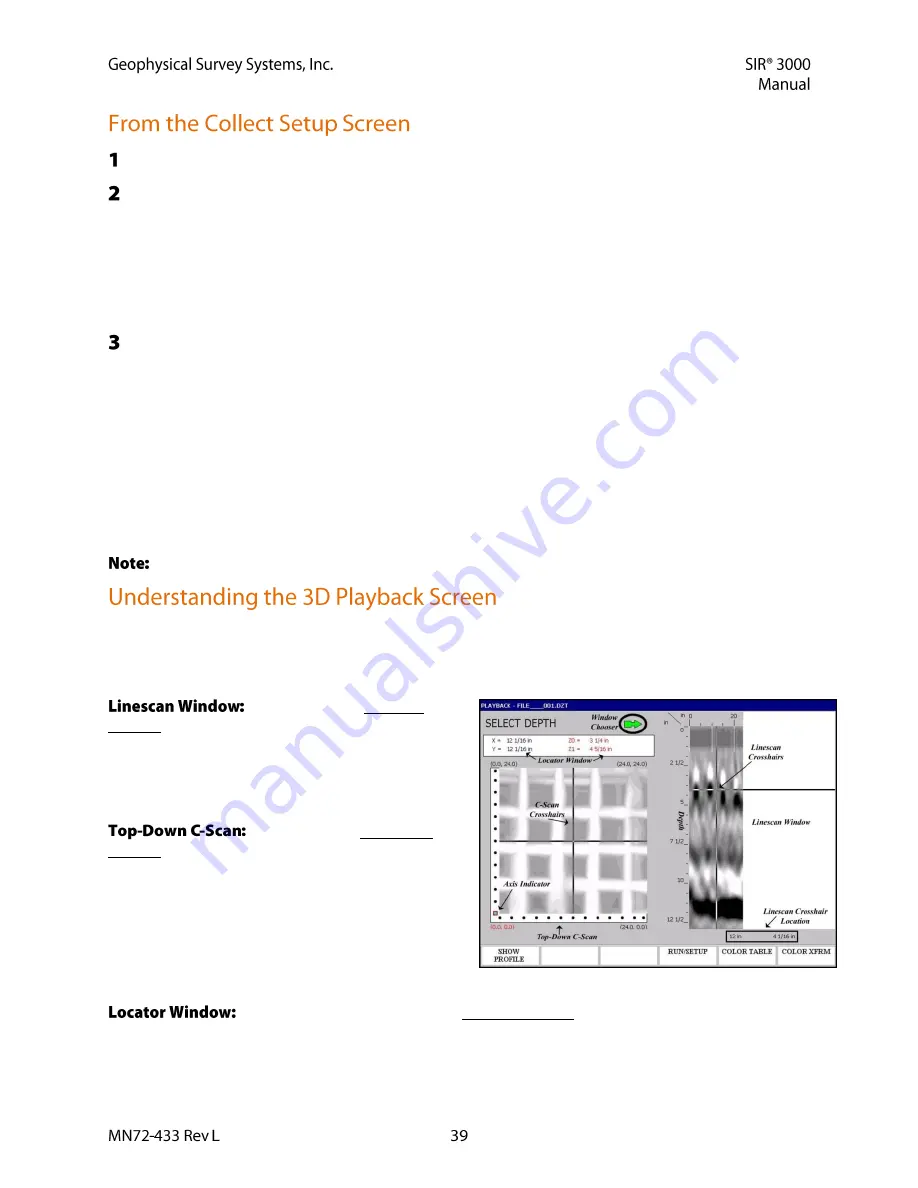
The C-scan (top-down) display window is split into 3 important areas.
At the right is the Linescan
window which shows a 2D vertical profile. Depth is
shown on the vertical axis and distance along the
survey profile is shown on the horizontal. Underneath
this display are two coordinates. The first is distance,
and the second is depth.
At the left is the Top-Down
C-Scan map. This map shows the location of targets
as if you were standing above your survey area and
looking straight down. At the lower left corner is 0,0.
The X axis is horizontal and the Y is vertical. The
black dots along two of the sides are the locations of
profiles. You will also see a red box (Axis Indicator)
covering one of the dots. That is the currently
selected profile and the one that will be displayed in the linescan window if you press Show Profile.
Above the C-Scan window is the Locator Window. This window gives positioning
information for the C-Scan crosshairs and also shows the highest (Z0) and lowest (Z1) points of the depth
slice shown in the C-Scan.

