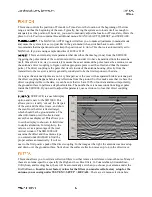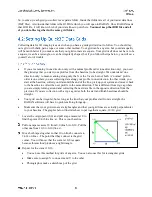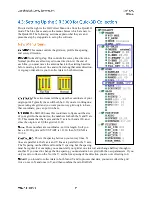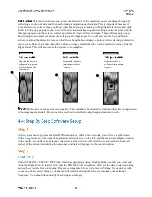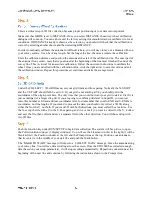
The scan spacing (horizontal resolution) of Time-based data profiles is a function of the speed that the
system is collecting data and the rate that the antenna is moving over the survey surface. The higher you
set the RATE (in scans/second) and the slower you move the antenna, the denser the data will be.
Time-based data has no real distance tag, so the software has no idea how far you actually traveled. It is
extremely important to move the antenna at a constant speed and to add user marks (by clicking the mark
button) at consistent intervals. Time-based data requires additional processing in RADAN to create a 3-D
image. If 3-D imaging is your goal, you should collect Distance based data with a survey wheel.
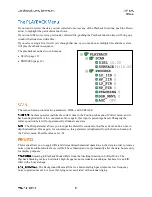
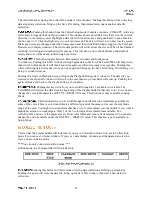
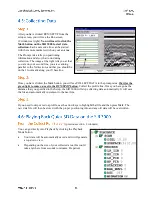
After system boot-up, press the TerraSIRch function key. After a few seconds, you will see a split screen
with a wiggle trace on the right, the parameter selection tree on the left, and the main data display window
in the center. If you have an antenna connected, a blue wait bar will scroll twice across the bottom left
corner of the screen (initializing the antenna), and data will appear in the center window.
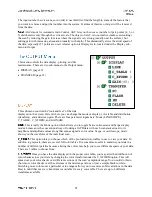
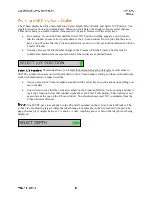
Examine the parameters in the Collect tree to ensure that the system is properly configured for the
antenna you are using.
Load SETUP
Under the System menu, open SETUP and RECALL a factory setup for the antenna that you are using or
a saved setup that you have worked with previously.
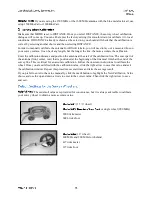
Under the Collect > Radar menu, ensure that MODE is set to TIME.
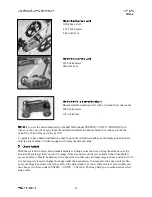
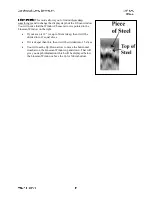
With the system in Collect Setup mode and data scrolling across the screen, drag the antenna over the
area and find a target that you want to image. Note its position on the screen and at what time/depth it
occurs. Ideally, it should be halfway down the screen so that you can image targets above and below it. If
it is not properly located, change the range under the Scan menu.
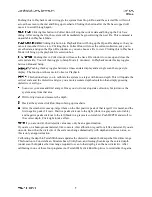
This number will be scans per second. Your data density now depends on the rate you move the antenna
over the survey surface. Typically this value is set much lower than the maximum.
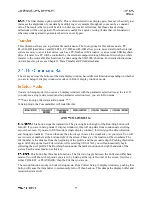
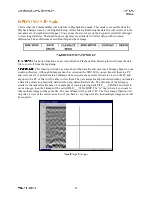
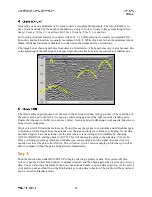
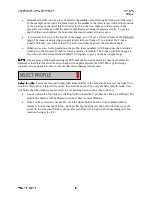
The thin, red line superimposed over the scan in the O-Scope window is the gain curve. The centerline of
the scan is zero and to the left of it is negative (removing gain) and the right is positive (adding gain).
Ensure that the scan is visible (you can see curves). If not, select AUTO under the GAIN menu. This will
cause the system to re-initialize and ADD/REDUCE gain to produce a visible signal. Drag the antenna
over the area and look for evidence of clipping. If your data becomes clipped, leave the antenna over the
area where it is occurring and re-initialize by changing AUTO to MANUAL and then back to AUTO.
This will depress the gains so that the data will not clip.


