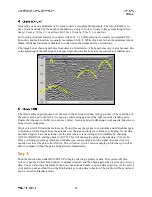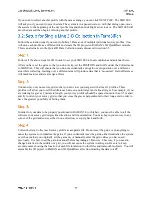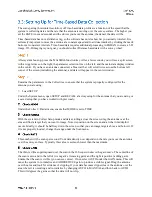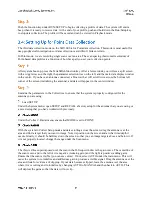
The last choice is SCN/UNIT, or scans per unit of horizontal distance. This parameter is the
scan spacing when you are collecting with the survey wheel.
Having a smaller scan spacing produces higher resolution data, but larger file sizes. The number
here is the number of scans that the system will collect per unit of distance. So for example, if
you see a 12 here and the system is set to English feet, rather than Metric units, you will collect
12 scans per foot, or 1 per inch.
The StructureScan setting for shallow structural features in concrete is 60 scans/foot or
5 scans/inch. The StructureScan setting also allows you to set to 7.5 and 10 scans/inch. Ten per
inch is the densest recommended scan spacing, and it is only meant for the 1.5/1.6 GHz, 2.0 GHz
Palm and the 2.6 GHz antennas.
Lower frequency antennas, like the 400 MHz will require coarser scan densities
(12-24 scans/foot).
This value is for display purposes. It will apply a display gain to the data that may make the data
easier to view while collecting. This will not be saved with the data file.
Gain is the artificial addition of signal in order to counteract the natural effects of attenuation. As a radar
scan travels into the ground, some of the scan is reflected, some of it is absorbed, and some of it keeps
traveling down. As the scan gets deeper, it becomes weaker. We apply gain to the scan to make the subtle
variations in weaker data more visible. The two choices under the gain menu are a MANUAL/AUTO
toggle and a listing of point numbers.
Setting the GAIN to MANUAL will allow you to change the number of gain points and to add
strength to the signal at your own discretion. This is not recommended for inexperienced users as
it is possible to ‘create’ features in the data by over-gaining areas.
Setting the gain back to Auto will cause the system to re-initialize and adjust its gains to the area
under the antenna. This is useful if you find that your data is clipped (over-gained) over a
particular section of your survey area. Just place the antenna on the area where the data is clipped
area and toggle the gain to Manual, and then back to Auto. This will cause the system to reset the
gains to a lower level, and prevent clipping.
Gain is applied at a number of evenly spaced points throughout the data scan. You can select up
to 5 gain points, and then manually add or subtract gain values from individual points.
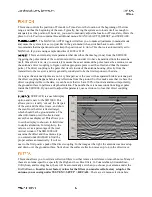
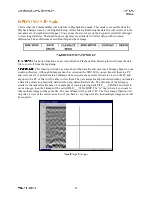
The gain curve is visually represented by a red line in the O-Scope window on the Setup screen.
Values increase from left to right and the location of gain points is shown by a change in the
slope of the curve.
Use caution not to add too much gain to a single point because you may create what will look like
a layer in the data. The software will automatically adjust lower gain points to be equal to or
greater than higher points. This is done to avoid a negative gain slope.
The SIR 3000 is only displaying about 25% of the amplitude range. This means that even if your
data appears slightly clipped, the SIR 3000 is likely still recording the full amplitude range of the
reflection. If you use a –12 dB display gain, you will see an accurate representation of the recorded scan.
This also means that when you view your data in RADAN, it will appear under-gained and you will need
to add some display gain.

