


Mini-X Installation, Setup & User Manual GRT Avionics
Revision A9 74
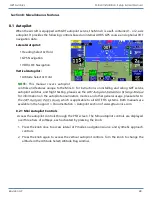
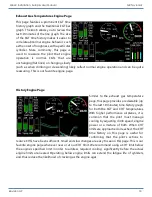
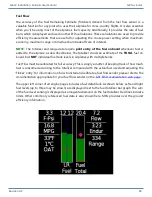
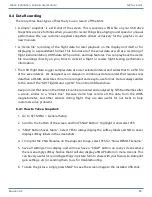
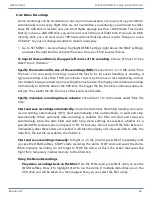
Exhaust Gas Temperatures Engine Page
This page features a prominent EGT time
history graph and the traditional EGT bar
graph. The knob allows you to review the
last 10 minutes of the line graph. The size
of the EGT time history makes it easier to
correlate abnormal engine behavior, such
as the onset of roughness, with a particular
cylinder. More commonly, this page is
used to reassure the pilot that engine
operation is normal. EGTs that are
unchanging (flat lines) or changing slowly
(such as when climbing or descending) likely reflect normal engine operation and can be quite
reassuring. This is our favorite engine page.
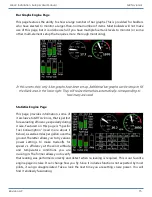
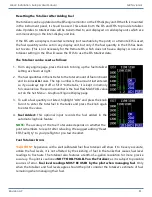
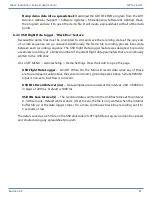
History Engine Page
Similar to the exhaust gas temperature
page, this page provides a reviewable (up
to the last 10 minutes) time history graph
for both the EGT and CHT temperatures.
With higher performance airplanes, it is
common that the pilot must manage
cooling by adjusting climb speed, engine
power or a mixture of both. When CHT
limits are approached or reached, the CHT
time history on this page is useful for
confirming that the pilot’s actions to
reduce CHTs have been sufficient. Small and slow changes are easy to see on this page. This is our
favorite engine page whenever near or at our CHT limit. We recommend using a CHT limit below
the engine’s specified limit in order to address required cooling significantly before the actual
engine limits are neared. Operating below engine limits can extend the fatigue life of cylinders,
and thus reduce the likelihood of cracking as the engine ages.


