LiAir
22
0N User Guide • GreenValley International Inc.
Page 34
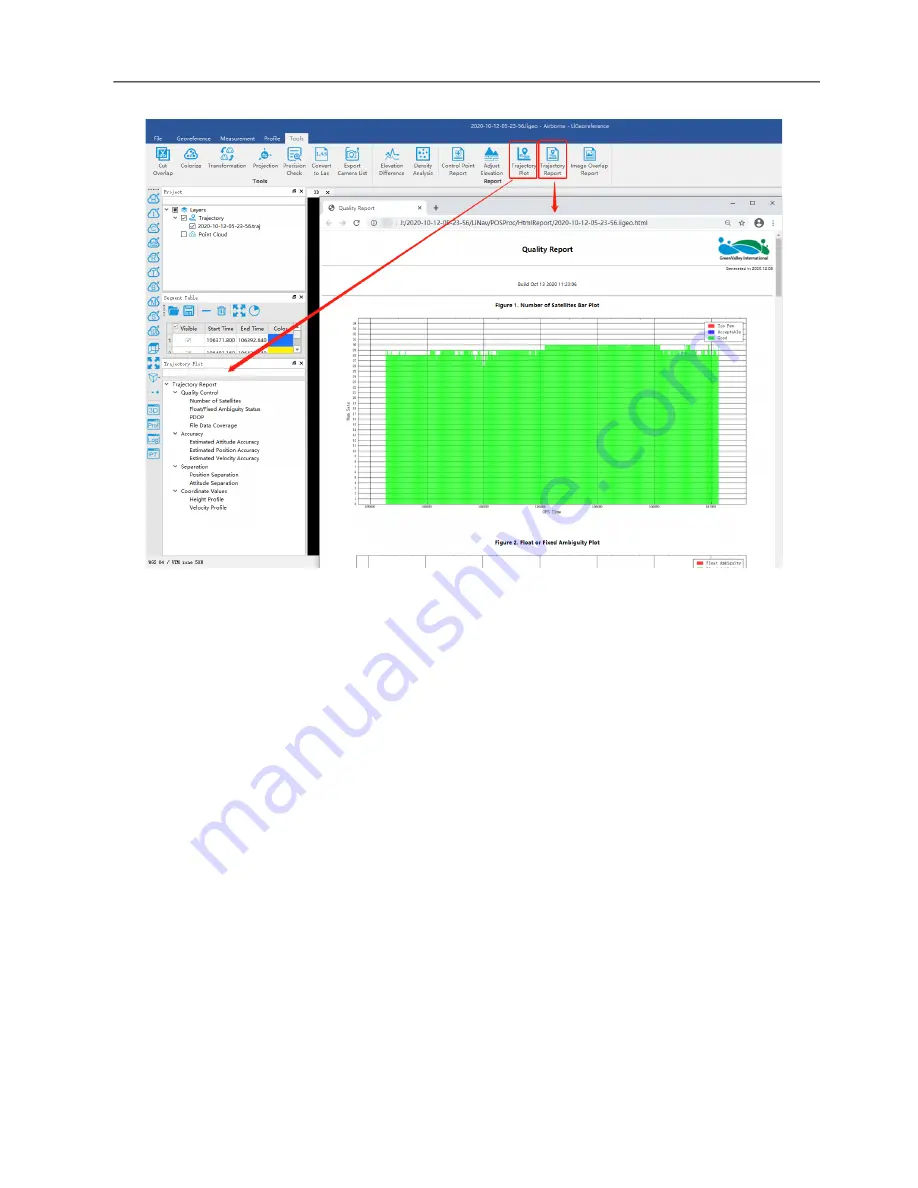
Figure 29. “Report"
Display Interface
•
Satellites Number:
Click to open the plot to show the relation between number of satellites,
which can be reached, and the GPS time. This tool is used to show the number of satellites can
be reached by the device each time during the data acquisition. Satellites number is shown on
the Y-axis. The green part on the plot means the number of satellites is good at that time. The
blue part on the plot means the number of satellites is just acceptable at that time. While the
red part means the satellite number is too few to meet the requirement. The insufficient GNSS
signal will result in poor data quality. If the number of satellites can be reached by the device is
too few during a period of data acquisition, user can select the time period and right-click on
that. Then click “Go to Time” button to find out the corresponding period on the trajectory.


