Made in Germany
© Gigahertz Solutions GmbH
- 19 -
NFA1000_4.6_e.doc as of July 2010
8.1.1 Diagram Window
The figures at the y-axis are without dimensions. Their units you find in the respec-
tive “Statistics/Channels” window. This permits to display channels with different
units simultaneously.
The X-Axis shows the time. In the left and the right end of the grey status line there
are the clock times of beginning and end of the time span just selected for analysis.
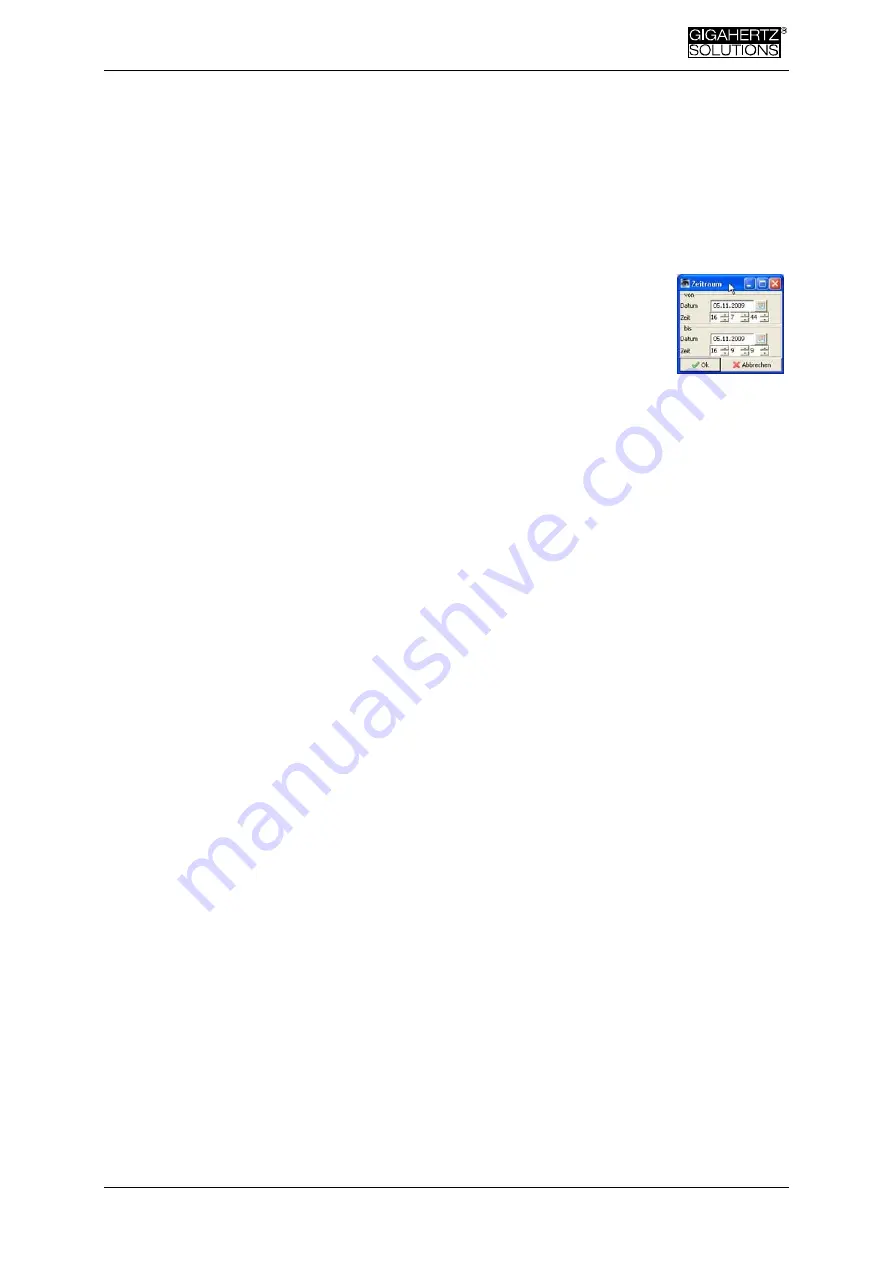
Upon a mouseclick on this status line a window like like the one
shown on the right opens up. It is made for selection of a dedicated
time span to be shown in the diagram (alternatively the time span
can be selected by the menu (“View”).
The colouring of the diagram is as per the standards for building biology measure-
ments (SBM):
Green for “no concern”.
Yellow for “slight concern”.
Red for “severe concern”
Purple for “extreme concern”.
If you selected two channels with different units, the SBM colouration will be the one
for the Channel marked bold in the “Statistics/Channels” window.
Activate „Edge display“
In the drop-down menue “View” one can activate “edge steepness”. The horizontal
beam on top of the diagram marks rising edges of a steepness or increment defined
beforehand,
bold
for the channel marked,
fine
for the others, and all in the colour
code of the “Statistics/Channels” section on the left. This way one has always an
overview of what happens in other channels even while e.g. just investigating the 3D
channel. The threshold for display of edges can be defined in the menue „Channel /
Set edge criteria“. (For further explanations see down below)
Navigation within the Diagram
A mouse with scroll wheel facilitates navigation considerably. Move the mouse sym-
bol into the diagram . The scale of the x-axis will be
zoomed in when scrolling up (alternatively use the button “arrow up” ••)
zoomed out when scrolling down ( ••)
with the center of the zoomed time slot remaining at the clock time indicated by
the mouse. This way you can quickly look at any interesting event.
If you have zoomed in you can shift the zoomed area right or left by mouse with it’s
left button pressed down. Or use the button “arrow right” or “arrow left” (
→
←
).
You can adapt the scaling of the Y-axis also manually via menue (under “View /
Scale”).


