Instructions for Use
CPET
Version: 4 | Release date: 01 April 2022
page 41
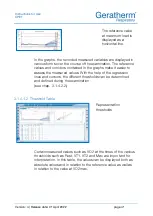
The reference value
at maximum load is
displayed as a
horizontal line.
In the graphs, the recorded measured variables are displayed in
various forms over the course of the examination. The reference
values and corridors contained in the graphs make it easier to
assess the measured values. With the help of the regression
lines and cursors, the different thresholds can be determined
and defined during the examination
(see chap. 3.1.4.2.2).
3.1.4.1.2
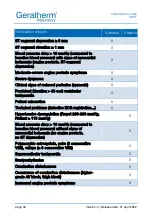
Threshold Table
Representation
thresholds
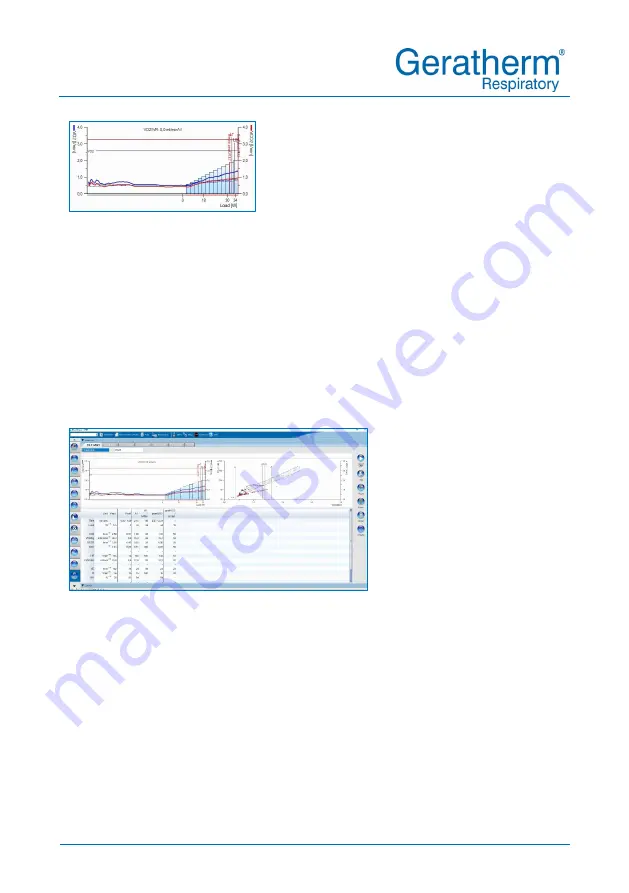
Certain measured values such as VO2 at the times of the various
thresholds such as Rest, VT1, VT2 and Max are important for
interpretation. In this table, the values can be displayed both as
absolute values and in relation to the reference value as well as
in relation to the value at VO2max.

