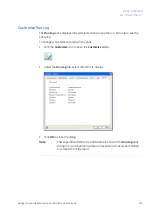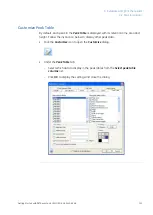
Customization
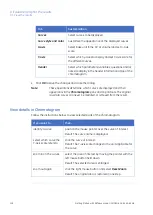
Tab
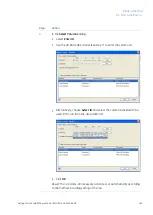
Select curves to be displayed.
Curves
Customize the appearance of the displayed curves.
Curve style and color
Select base unit (time, CV or volume) and set X-axis
scale.
X-axis
Select which y-axes to display and set Y-axis scale for
the different curves.
Y-axis
Select which parameters (variables, questions and/or
notes) to display in the header information at top of the
chromatogram.
Header
•
Click OK to save the changes and close the dialog.
Note:
These operations determine which curves are displayed and their
appearance in the Chromatogram pane and on printouts. The original
raw data curves can never be modified or removed from the result.
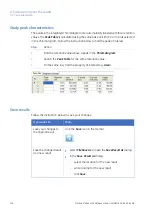
View details in Chromatogram
Follow the instructions below to view selected parts of the chromatogram.
then...
If you want to...
position the mouse pointer over the curve of interest.
identify a curve
Result: The curve name is displayed.
click the curve of interest.
select which curve the
Y-axis scale refers to
Result: The Y-axis scale changes to the unit applicable for
the curve.
select the area of interest by moving the pointer with the
left mouse button held down.
zoom in on the curves
Result: The selected area is enlarged.
click the right mouse button and select Reset Zoom.
zoom out again
Result: The original area is restored in one step.
118
Getting Started with ÄKTAavant and UNICORN 6 28-9440-69 AB
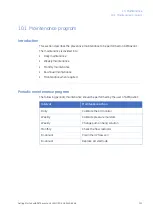
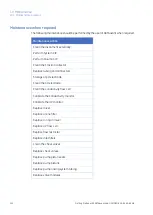
9 Evaluate and print the results
9.1 View the results
Содержание AKTA avant
Страница 1: ...GE Healthcare Getting Started with KTAavant and UNICORN 6...
Страница 2: ......
Страница 133: ......


