


Analyzing Recorded Data
60
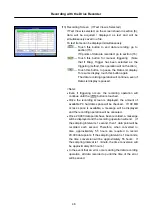
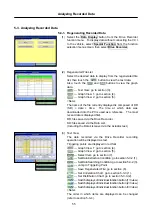
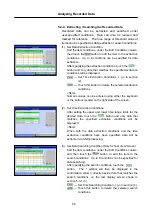
(2) Correlation Chart
Recorded data is displayed in the form of a correlation
chart under the specified conditions.
--- Touch this button to return to the Set Correlation
Chart screen: go to section (1).
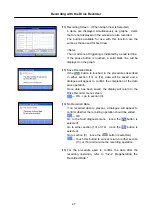
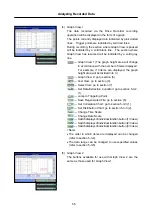
(3) Set Distribution Chart
Touch the button to display the distribution chart,
after first specifying the time range for the subject data, as
well as the item names, data range, division width and
frequency range.
Analog data and voltage data can be plotted on the
distribution chart.
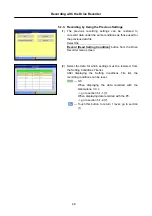
•
Time Range: time range for the data to be plotted.
•
Subject Items: items plotted.
•
Data Range: range of data for the items plotted.
•
Data Division Width: width of data divisions.
•
Frequency Range: maximum frequency for the Y-axis (if
"0" set to the optimum value to
display the maximum frequency for
each division width).
<Note>
Numeric values can be entered using either the keyboard
or the buttons located on the right side of the screen.
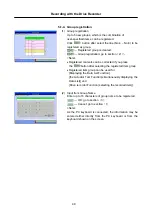
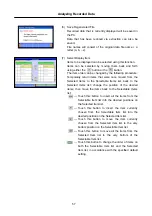
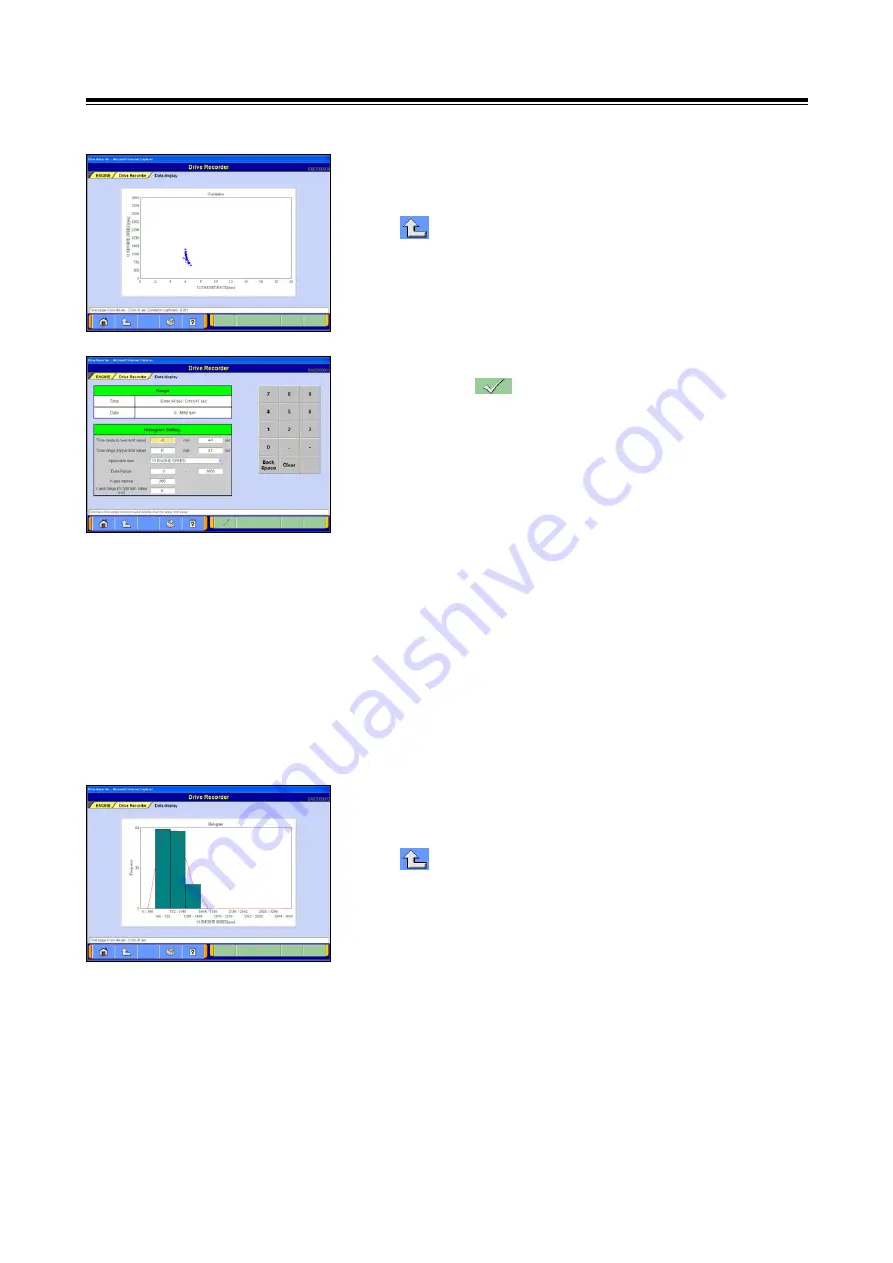
(4) Distribution Chart
Recorded data is displayed in the form of a distribution
chart under the specified conditions.
--- Touch this button to return to the Set Distribution
Chart screen: go to section (3).


