

Operating Procedures for the Data List
26
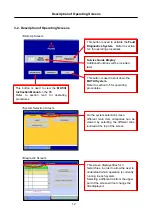
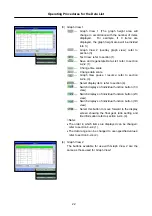
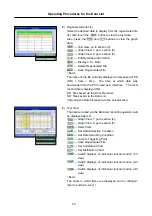
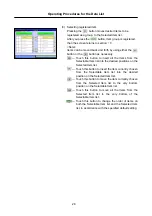
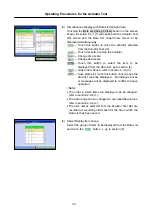
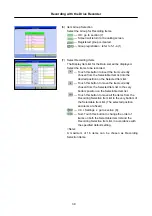
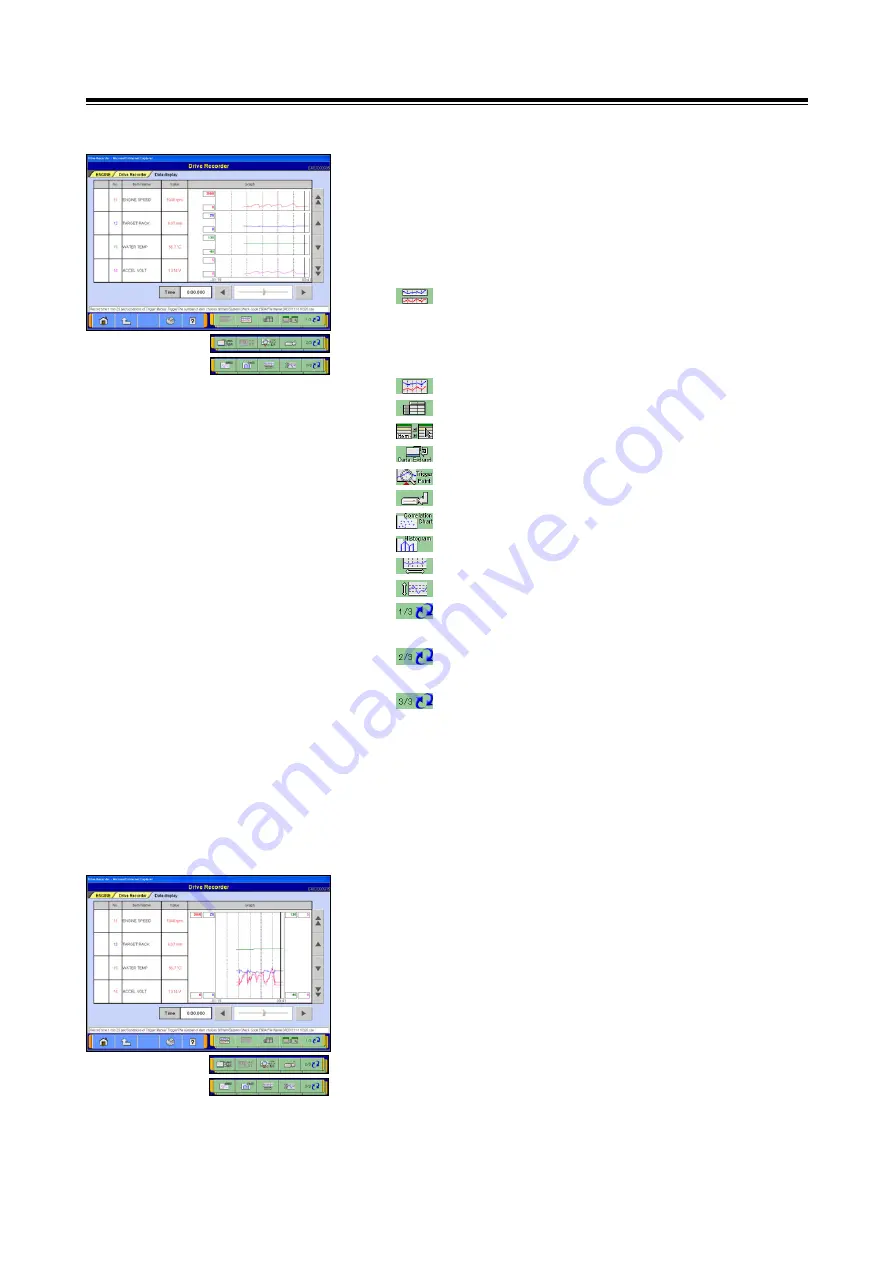
(4) Graph View 1
The data recorded via the Data List recording operation will
be displayed in the form of a graph.
The points currently displayed are indicated by pink dotted
lines. During recording, the section where Graph View is
paused will be indicated by a solid black line.
--- Graph View 1 (The graph height area will change
in accordance with the number of items displayed.
For example, if 3 items are displayed, the graph
height area will be divided into 3.)
--- Graph View 2: go to section (5).
--- Text View: go to section (3).
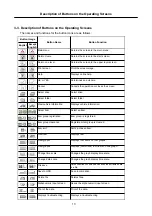
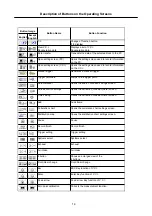
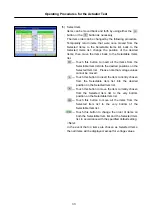
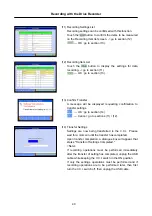
--- Select Item
--- Set Data Extraction Condition
--- Jump to Triggering Point
--- Save Regenerated File
--- Set Correlation Chart
--- Set Distribution Chart
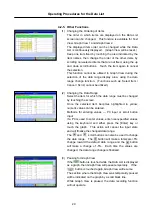
--- Change Time Scale
--- Change Data Scale
--- Switch displays of individual function button (1/3
view)
--- Switch displays of individual function button (2/3
view)
--- Switch displays of individual function button (3/3
view)
<Note>
•
The order in which items are displayed can be changed:
refer to section 4-2-4.(1).
•
The data range can be changed to user-specified values:
refer to section 4-2-4.(2).
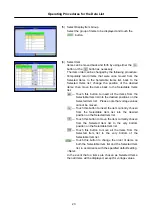
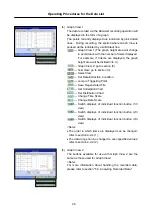
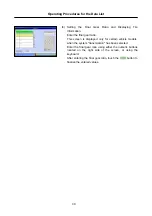
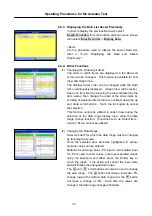
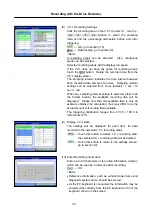
(5) Graph View 2
The buttons available for use with Graph View 2 are the
same as those used for Graph View 1.
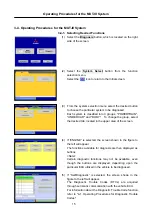
<Note>
For more information about handling the recorded data,
please refer to section "5-3. Analyzing Recorded Data."


