Measuring Examples
7 - 11
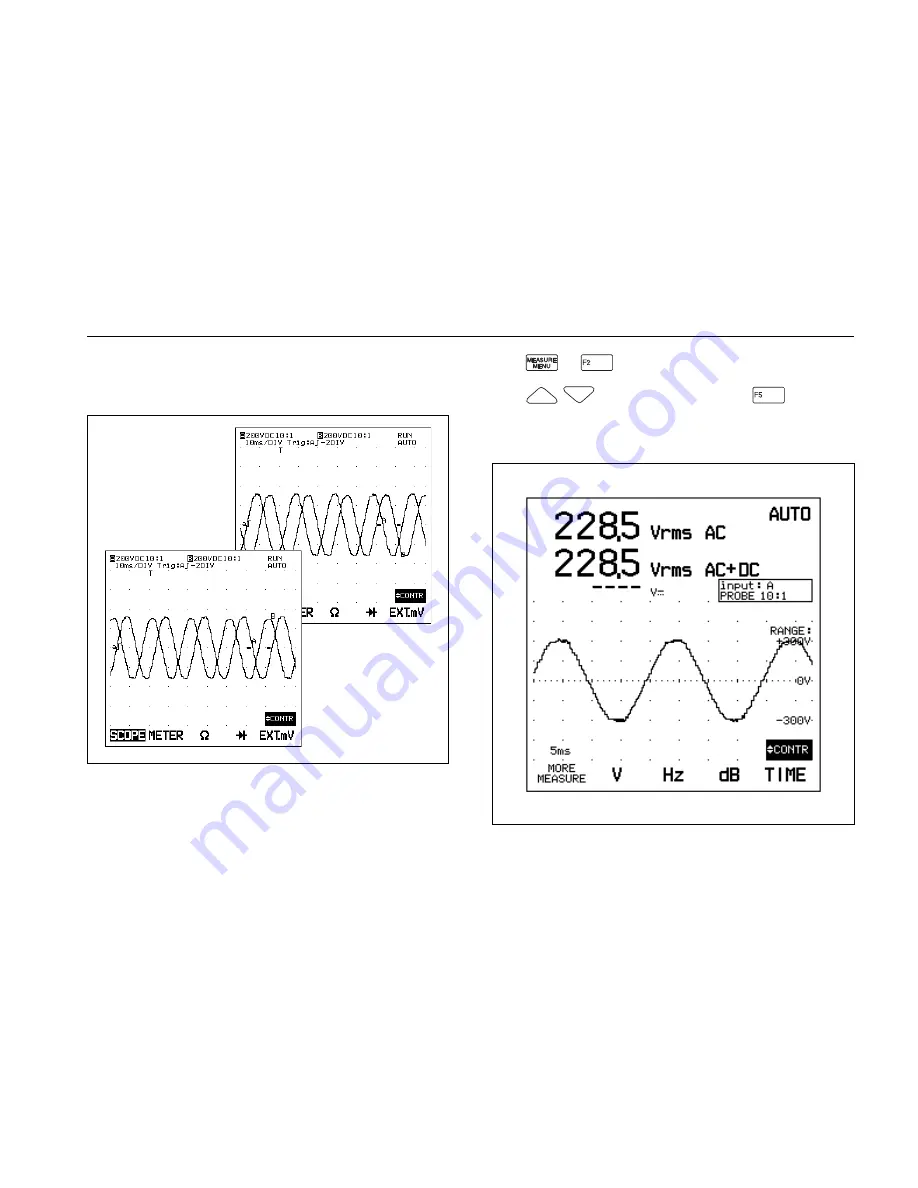
The upper display in Figure 7-10 shows that phase 2
(INPUT B) follows phase 1 (INPUT A). The lower display
shows that phase 3 follows phase 1.
Figure 7-10 Phase Measurements
➅
➪
➆
: Vrms
AC
(METER)
➪
The Volt RMS readout (about 230 Vrms) appears on the
display. (see Figure 7-11.)
Figure 7-11 AC Volt RMS Measurement
Содержание 105 Series II
Страница 6: ...V ...
Страница 14: ...XIII Figure 2 Demo Board Non conductive surface ...
Страница 15: ...XIV 91 92 96 99 105 Users Manual ...
Страница 17: ...XVI 91 92 96 99 105 Users Manual ...
Страница 204: ...10 34 91 92 96 99 105 Users Manual Figure 10G 5 EXT mV menu MORE EXT mV ALERT ZERO FAST SMOOTH RESET READING ...
Страница 205: ...Appendixes 10 35 Figure 10G 6a MEASURE menu MORE MEASURE V dB TIME Hz See Figure 10G 6b ...
Страница 206: ...10 36 91 92 96 99 105 Users Manual Figure 10G 6b MEASURE menu MORE MEASURE V dB TIME Hz See Figure 10G 6a ...
Страница 212: ...10 42 91 92 96 99 105 Users Manual Figure 10G 13 SPECIAL FUNCTION menu MENU TEST MENU GENERATE MATH COMP 92 91 96 ...


