76
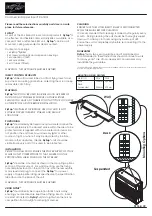
Fig. 42
Tap on
“Graphs”
at the top left to display the vision quality summary (Fig.43). This section displays:
Zernike Coefficient pyramid: represents the numerical value of each coefficient by means of a
grayscale; the greater the coefficient, the greater the color contrast with the pyramid background.
Point Spread Function: represents the intensity of the wavefront in the retina.
Spot Diagram: represents the spatial distribution of the wavefront over the retina.
Visus/Visus Low Contrast: represents the patient’s real vision with high and low contrast.
The data displayed refer only to the component induced by the anterior surface of the cornea, not by the
eye entire optical system.
Press the
“Maps”
button to return to the maps display.
The
“Pupil”
button opens a panel (Fig.43) where you can select the diameter of the pupil (in a range
between 2 mm and 7.5 mm) to see how the aberrations change as the pupil diameter varies.
Содержание MYOPIA EXPERT 700
Страница 1: ...MYOPIA EXPERT 700 Biometer USER MANUAL Rev 1 07 04 2021...
Страница 15: ...13 3 1 DEVICE SAMPLE LABELING...
Страница 24: ...22...
Страница 60: ...58 RX AL Refraction Axial Length trend Combined trend view with Refraction error S E and Axial Length...
Страница 63: ...61 Delete Button Delete the selected row...
Страница 79: ...77 Fig 43 It is possible to switch between ETDRS and Landolt C Visus simulation view...
Страница 82: ...80 Fig 46 14 4 2 3D Press the 3D button to view the 3D map of the altimetric data Fig 47 Fig 47...
Страница 94: ...92 Fig 59...