VISUAL CHECK
STEP 1 – SYSTEM OPERATION
CHECKING IN THE SERVICE DATABASE
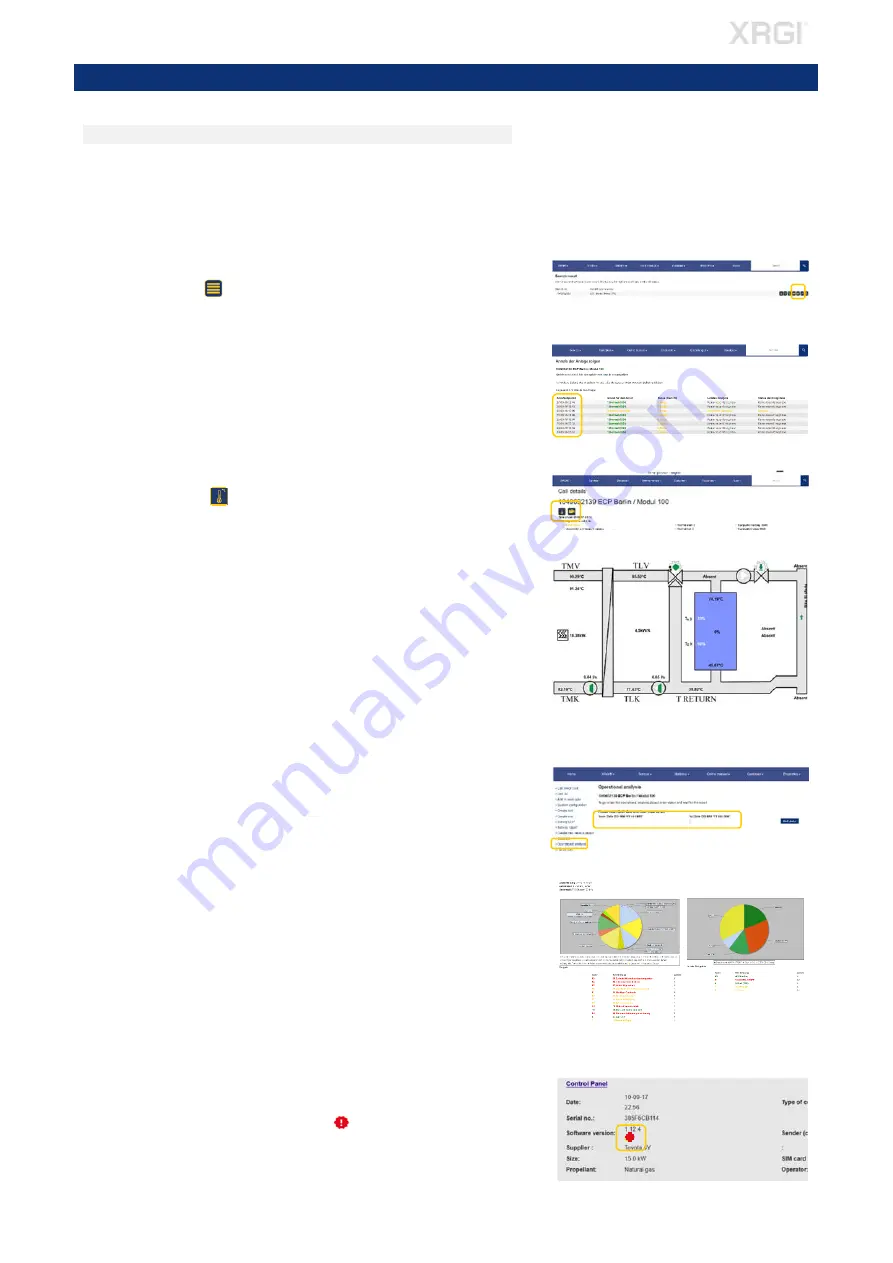
Check the runtime of the XRGI
®
system in the EC POWER service database –
https://service.ecpower.dk
Locate the desired XRGI
®
system in the search field in the service database
by typing the XRGI
®
-ID or object name.
CALL DETAILS
Click on the icon
List of calls
.
Click on one
Time of call
to get a detailed data of that call.
Check in particular for:
most recent events/alarms.
length of operating times (under 10 minutes per start implies insuffi-
cient heat dissipation) or hydraulic problems.
STORAGE STATUS
Click on the icon
Heat Distributor
, to get an overview of the storage
status.
Check for abnormalities with the storage status of previous switching points.
Please pay special attention to the following:
Is the TMV set point compensated (displayed as an operational set
point below the actual value)?
Are all temperatures shown in the service database and are the figures
viable?
Is the T-Return permanently below 65 °C (max. 70 °C)?
The temperature difference between TMK - TLK is ≤ 8K at full load
when operationally warm?
OPERATING ANALYSIS
In the left menu, click on
Operational analysis
and enter in the 2 search
fields a period for the desired operational analysis. Click on
Get data
.
Check for abnormalities in the operating analysis:
- Frequent faults
- Manual switching on site
- Operating time within the reference range
SOFTWARE VERSION
Check the software version of the XRGI
®
system.
Whether a new software is available for the XRGI
®
system is displayed
in the service database with the icon under
System configuration
,
System list
as well as
Unit list
.
Fig. 3.06
Fig. 3.02
3.
VISUAL CHECK
Fig. 3.03
Fig. 3.04
Fig. 3.07
Fig. 3.05
Fig. 3.01
6


