MOPA FIBER LASER
122
AREX™ 400
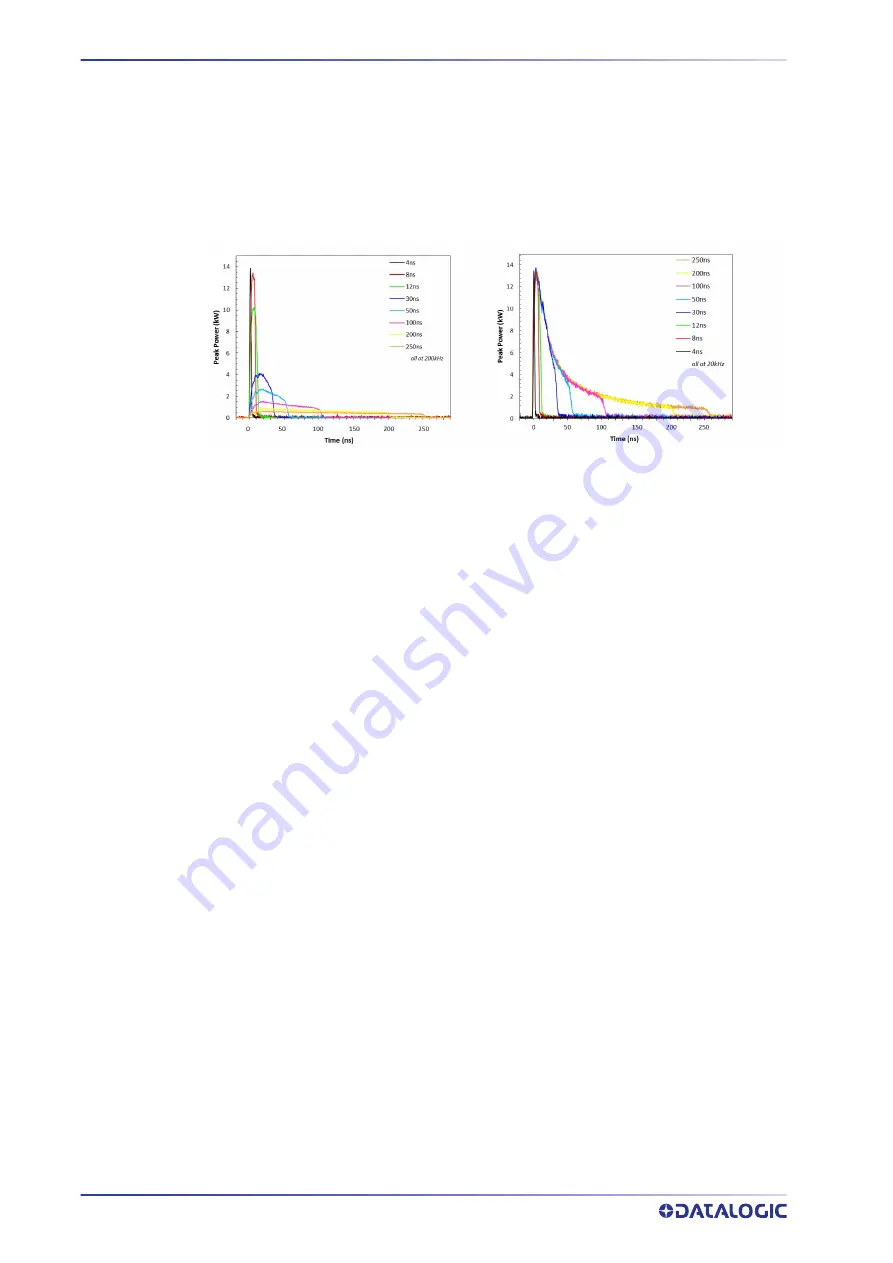
For the longer pulse profiles (above 20 ns), the pulse shape varies with pulse frequency
and Power level. Below the pulse transition frequency (fT), the pulse profile shape will
remain invariant, i.e., will not vary with pulse frequency, while above fT the shape will
vary with pulse frequency. Increasing the pulse frequency and/or decreasing the Power
level will make the pulse shape less “leading peak” like and more “square” like.
The following pictures illustrates for some typical Pulse Profiles, the pulse shape varia-
tion in the “Constant Average Power Region” and the “Constant Energy/Peak Power
Region”.
Figure 4: Typical optical output pulse shape in the “Constant Average Power Region” at
200kHz (left) and the “Constant Energy/Peak Power Region” at 20kHz (right)
If operating below transition frequency (fT), the user can vary the pulse energy without
any other setting change (namely Peak Power) by changing the Pulse Profile selected.
If operating above transition frequency (fT), the user can vary pulse peak power without
changing pulse energy by changing the Pulse Profile selected.
Содержание Arex 400
Страница 1: ...AREX 400 USER MANUAL InfraRed Fiber Laser Marker ...
Страница 64: ...NOTE SET UP 56 AREX 400 Figure 7 Connecting the monitor Minimum monitor resolution 800 x 600 VGA standard ...
Страница 145: ...USER MANUAL 137 APPENDIX H MECHANICAL DRAWINGS ...
Страница 146: ...MECHANICAL DRAWINGS 138 AREX 400 CONTROL RACK NOTE Please refer to Datalogic website for detailed drawings ...
Страница 147: ...SCAN HEAD USER MANUAL 139 SCAN HEAD NOTE Please refer to Datalogic website for detailed drawings ...


