66
Culligan® Series M2 Reverse Osmosis
66
Cat. No. 01023095
Test Data
Feed
Product
Concentrate
New
Now
New
Now
New
Now
Flow (gpm)
TDS (ppm)
Pressure (psi)
Temp. (°F)
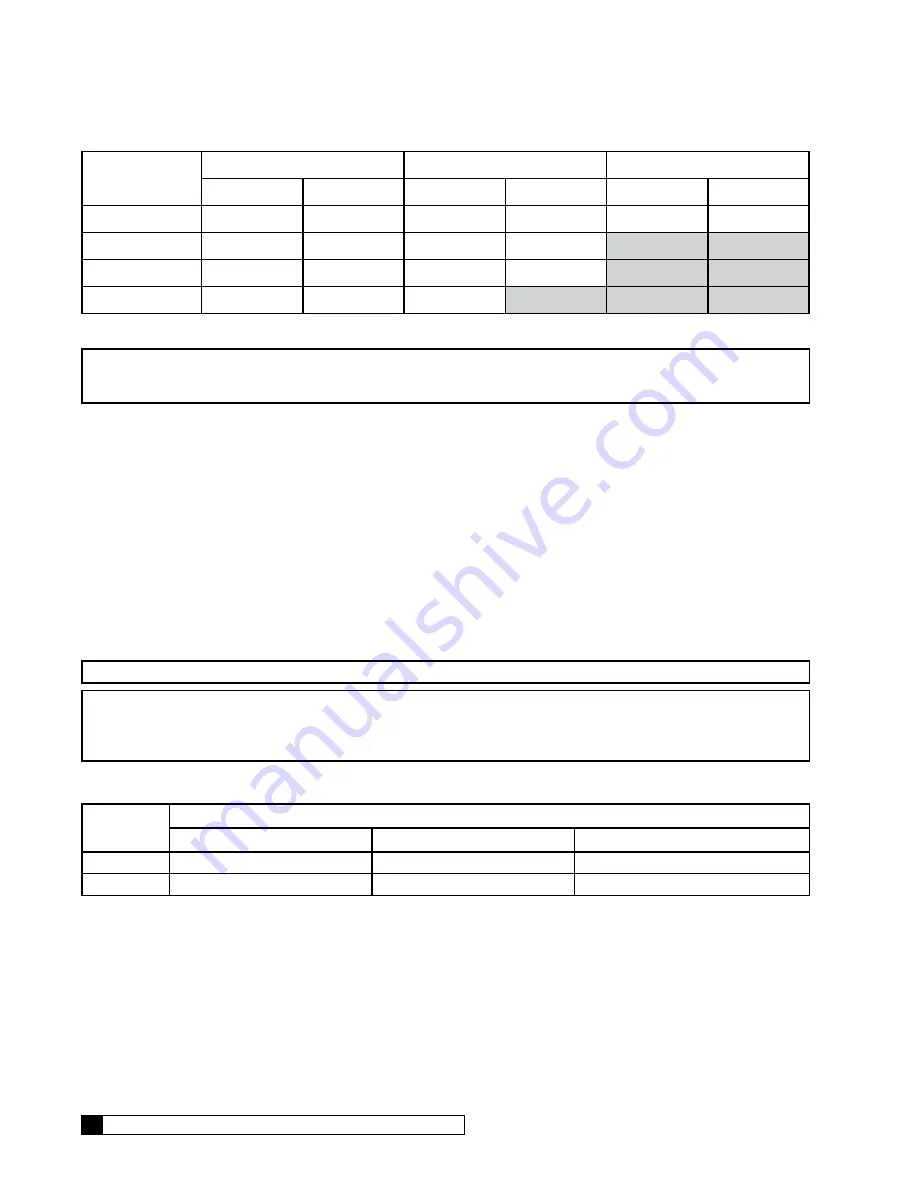
Table 7. System performance—new vs. present.
NOTICE
If new data is not available, use the specifications listed earlier in these instructions. However,
keep in mind that the new elements may have exceeded these specifications, so performance may
have decreased even if the unit still exceeds specifications.
In addition to differences in product flow and quality (TDS), determine whether there were any changes in concentrate wa-
ter flow, feed water TDS, feed water temperature and feed or product pressures. Changes in these values provide clues
to indicate the cause of any problems with the product water.
If there were changes in feed water temperature or pressure, the product water flow rates will have to be converted to flow
rates under standard conditions (77° F and 200 psig) in order for any comparison to be valid. Refer to the Product Flow
Calculation section to calculate flow rates under standard conditions, then compare the converted values. A decrease in
the product water flow may have been due only to a decrease in temperature or pressure, in which case cleaning would
not be indicated.
If any change in the performance of the elements was not due to a change in operating conditions, it may be time to clean
the elements. In general clean the elements:
1. When the product flow rate decreases by 10% (or when the feed pressure must be increased by 10% to main-
tain the same product flow), or
2. When the percent of rejection decreases below specification.
NOTICE
Replace the prefilter cartridges if they are discolored by iron.
NOTICE
Because strong chemicals are used to clean the elements, maintenance cleaning is not recom-
mended. If the elements need to be cleaned frequently (more than twice a year), the pretreatment
may be inadequate. Obtain a current water analysis and test the Silt Density Index and the Total
Chlorine level of the water on-site to review what changes in pretreatment may be needed.
When cleaning is required, the type of material which is fouling the element should be identified, if possible. Refer to
Table 8 to determine the possible causes of the performance change.
Percent
Rejection
Flow
Low
Normal
High
Low
Hardness Scale
Hardness Scale (light) or Iron
Membrane Damage
High
Silt or Biofouling
—
Membrane Damage (light)
Table 8. Performance change possible causes.
For example, if the product flow is low but the percent rejection is normal, the likely causes of the problem are silt or
biofouling. Please note that if the product flow rate has increased (with no increase in temperature or pressure) the likely
reason is damage to the membrane, which cannot be repaired by cleaning.


