[36]
Convergent-Design.com
Menu System
Waveform
WFM
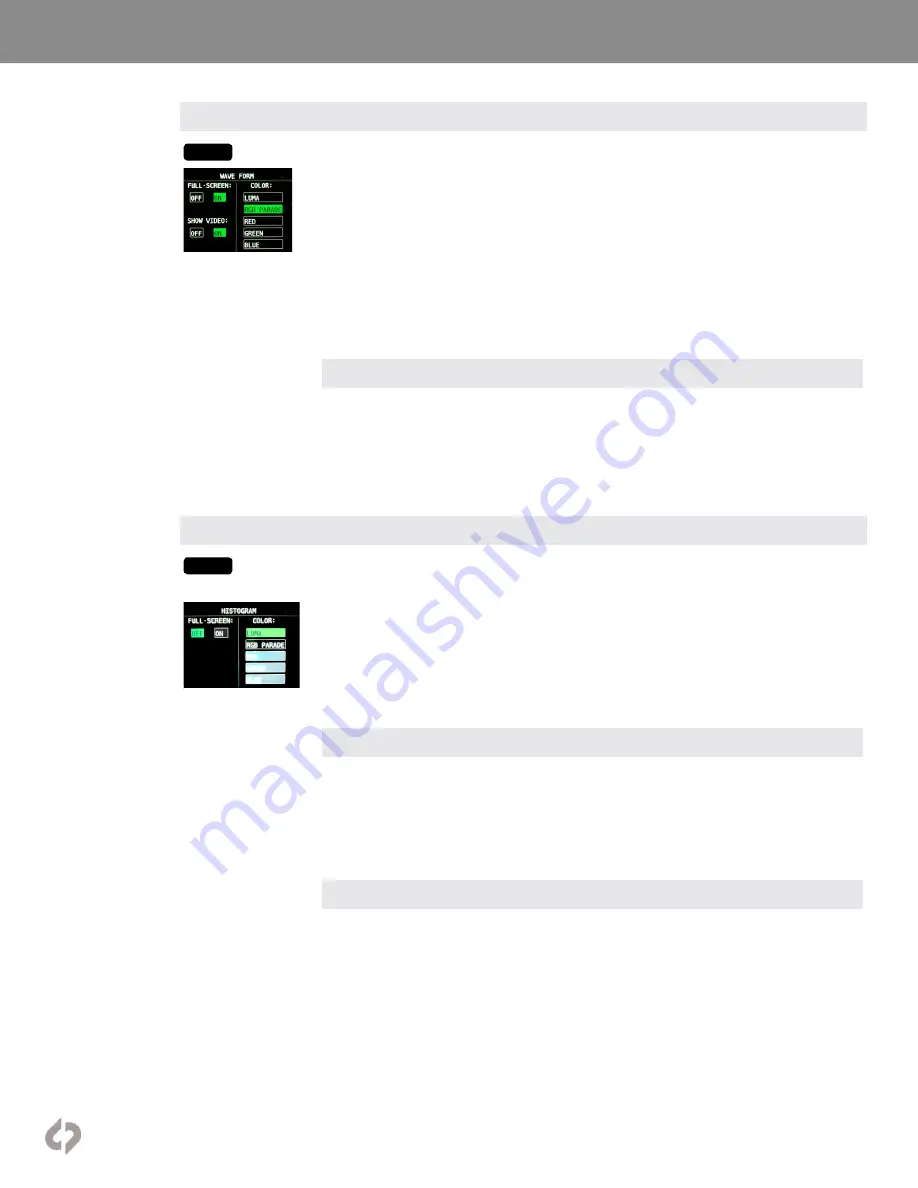
Tapping button activates Waveform. Holding button brings up Waveform settings. A Waveform is an
exposure tool used for measuring the brightness of the image throughout the frame. It can be set for
overall brightness (Luma), with the three color channels separated (RGB Parade), or as the individual
color channels only (Red, Green, or Blue). The Waveform display aligns left-right to the image on the
OLED display. In Multi-Stream mode, if two images are displayed side-by-side then the Waveform can
be used to compare the signals.
The Waveform can be displayed across the majority of the OLED screen or in the lower right corner. In
the large display, the RGB Parade shows three individual waveforms side-by-side in their appropriate
colors, while in the small display the three colors overlap. The Waveform background can be switched
between translucent and opaque to allow the video image to be visible behind the Waveform display
for reference. A graticule overlay indicates exposure value references in 10% increments in the large
display and 20% increments in the small display, both with an additional reference for 109%. The full
range displayed is from -7% to 109%.
TOOLS: LUT OPTIONS
The Waveform tool can be set to measure the source video signal or the video with a LUT applied to
it. This is a replication of a control in the LUT menu and adjusting it affects all Monitoring Tools. The
Monitoring Tools (False Color, Monochrome, Zebras Spot Meter, Waveform, Histogram, Vectorscope)
can always read the original input signal (LUT OFF), always read the LUTted image (LUT ON), or
switch between them depending on what is displayed on the OLED (MIRROR OLED). A green bar
connects the buttons for the monitoring tools to indicate when they are reading the LUTted image.
Histogram
HIST
Tapping button activates Histogram. Holding button brings up Histogram settings. A Histogram is
an exposure tool indicating brightness by volume of image across a horizontal plane. The brighter
the image the farther it is to the right. The more of an image registering at a particular brightness the
taller the line graph at that brightness. It can be set for overall brightness (Luma), with the three color
channels separated (RGB Parade), or as the individual color channels only (Red, Green, or Blue).
The Histogram can be displayed across the majority of the OLED screen or in the lower right corner. In
the large display, the Histogram can display Luma, RGB Parade (as color overlaps), or the individual
color channels (Red, Green, or Blue). In the small display Luma and RBG Parade (overlap) can be
displayed. On the large display, graticules indicates exposure value references in 10% increments with
an additional reference for 109%. The full range displayed is from -7% to 109%.
TOOLS: LUT OPTIONS
The Histogram tool can be set to measure the source video signal or the video with a LUT applied to
it. This is a replication of a control in the LUT menu and adjusting it affects all Monitoring Tools. The
Monitoring Tools (False Color, Monochrome, Zebras, Waveform, Histogram, Vectorscope) can always
read the original input signal (LUT OFF), always read the LUTted image (LUT ON), or switch between
them depending on what is displayed on the OLED (MIRROR OLED). A green bar connects the
buttons for the monitoring tools to indicate when they are reading the LUTted image.
MORE TOOLS
This setting alternates the button on the Lower Tool Bar to the left of the HIDE button between the
HISTOGRAM tool and the VECTORSCOPE tool.


