74
Understand Your Glucose Readings
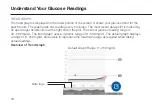
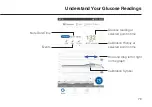
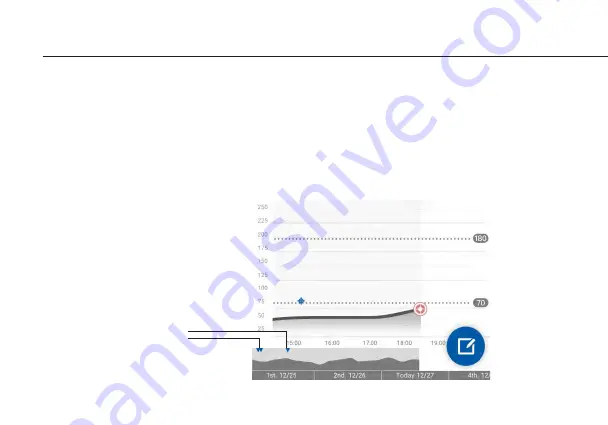
TREND GRAPH
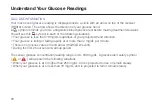
The trend graph is displayed on the lower portion of the screen. It shows your glucose trend for the
past 6 hours. The graph adds one reading every 5 minutes. The most recent data point is marked by
an open-target double circle at the right end of the plot. The sensor glucose reading range is
40 - 500 mg/dL. The trend graph uses a dynamic range of 0 - 500 mg/dL. The default graph displays
a range of 0 - 250 mg/dL and is able to reproduce the maximum range as required when taking
actual readings.
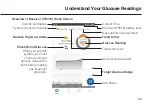
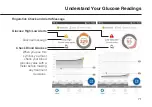
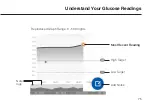
Overview of Trend Graph
Default Graph Range: 0 - 250 mg/dL
Note logs
Содержание RIGHTEST HR310
Страница 2: ...1...
Страница 16: ...15...
Страница 34: ...33...
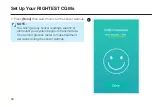
Страница 38: ...37 Set Up Your RIGHTEST CGMs 4 When the receiver HR310 prompts you to pair the sensor transmitter choose Pair 4...
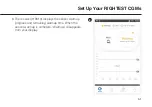
Страница 43: ...42 Set Up Your RIGHTEST CGMs 9 Once connected pairing confirmation is displayed as by checkmark the screen 9...
Страница 57: ...56 Set Up Your RIGHTEST CGMs 3 Wait for successful connection confirmation with a graphic 3...
Страница 59: ...58 Set Up Your RIGHTEST CGMs 5 5 Press Add Now to configure your 4 digit security code...
Страница 60: ...59 Set Up Your RIGHTEST CGMs 6 You will be prompted to enter your personal security code Then press Done 6...
Страница 64: ...63 Ending a Monitoring Session...
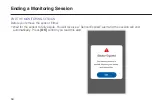
Страница 68: ...67 Ending a Monitoring Session 1 3 4...
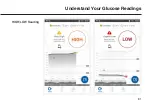
Страница 82: ...81 Understand Your Glucose Readings HIGH LOW Reading...
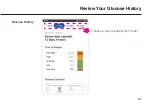
Страница 84: ...83 Review Your Glucose History Glucose History Choose a report duration from here...
Страница 126: ...125...
Страница 128: ......

