


Displaying Data
6
6000 Series Oscilloscope User’s Guide
279
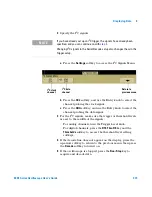
You can use the
Zoom
horizontal sweep mode for easier
navigation of the acquired data.
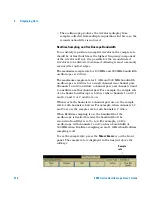
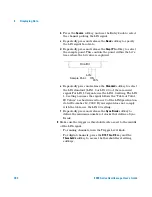
Interpreting Decoded SPI Data
•
White lines show an idle bus.
•
Blue rectangles show an active bus (inside a packet/frame).
•
The number of clocks in a frame appears in light-blue above
the frame, to the right.
•
Decoded hexadecimal data values appear in white and may
extend beyond the frame if an idle period follows.
•
Red dots in the decode line indicate that there is data that is
not being displayed. Scroll or expand the horizontal scale to
view the information.
Содержание InfiniiVision 6000 Series
Страница 1: ...Agilent Technologies Agilent InfiniiVision 6000 Series Oscilloscopes User s Guide ...
Страница 60: ...60 6000 Series Oscilloscope User s Guide 1 Getting Started ...
Страница 126: ...126 6000 Series Oscilloscope User s Guide 3 Viewing and Measuring Digital Signals ...
Страница 292: ...292 6000 Series Oscilloscope User s Guide 6 Displaying Data Interpreting Decoded LIN Data ...
Страница 314: ...314 6000 Series Oscilloscope User s Guide 6 Displaying Data ...
Страница 354: ...354 6000 Series Oscilloscope User s Guide 8 Reference ...
Страница 362: ...362 6000 Series Oscilloscope User s Guide 9 ...