UAV- M I CROPORTA B LE A N A LY ZE R S |
G L A 1 3 3 SER I E S | U M/G L A 1 3 3 - EN R E V. B
21
. . .7 User Interface Operation
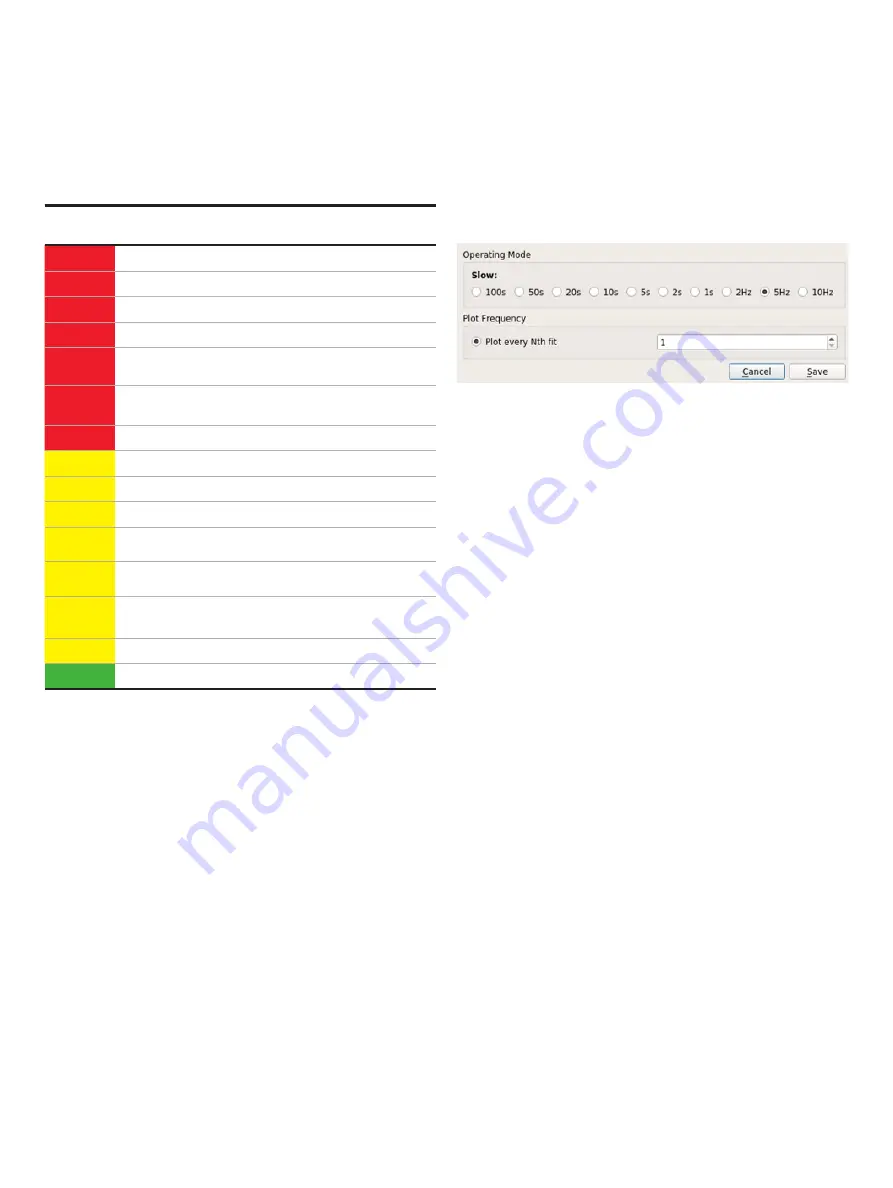
Figure 27 Rate Control Screen
Table 11 describes the analyzer alarm status .
Table 11: Analyzer Alarm Status
Warning /
Alarm
UI Display
Detected Problem
Alarm
Data Health
Laser goodness of fit is poor
Alarm
Pressure
Pressure is not in operating range
Alarm
HD Space
Disk space is low, deleting oldest files
Alarm
Mirror Health
Mirror health has degraded; clean mirrors
Alarm
Linelock
Laser peak position is outside of control
range, contact customer support
Alarm
Signal Power
Laser power has degraded, contact
customer support
Alarm
Maintenance
Maintenance is needed on system now
Warning
Data Health
Laser goodness of fit is poor
Warning
Pressure
Pressure is noisy
Warning
HD Space
Disk space is low
Warning
Mirror Health
Mirror health is degrading; clean mirrors
soon
Warning
Linelock
Laser peak position is outside of control
range, contact customer support
Warning
Signal Power
Laser power has degraded, contact
customer support
Warning
Maintenance
Maintenance is needed on system soon
No issue
No warning/alarm
Rate Button
The
Rate
button on the
Control Bar changes the rate at which
data are written to the log file . Figure 27 displays the
Rate
Control pop-up box, which appears when the
Rate
button is
clicked .
The
Operating Mode radio buttons select the rate at which data
are acquired . It is recommended to set the data acquisition
rate between 1 Hz and 10 Hz (5 Hz is the default value) . All data
sampled are written into the data file and plotted on the time
chart . Longer averaging periods (or equivalently, slower data
acquisition rates) yield better measurement precision than
shorter averaging periods .
Use the
Plot every Nth fit
radio button to automatically set the
rate at which the data are updated on the Main panel display .
For example, if you set the value to 5, a data point will be saved
every 5 seconds .


