


20
UAV- M I CROPORTA B LE A N A LY ZE R S |
G L A 1 3 3 SER I E S | U M/G L A 1 3 3 - EN R E V. B
. . .7 User Interface Operation
Timechart Display
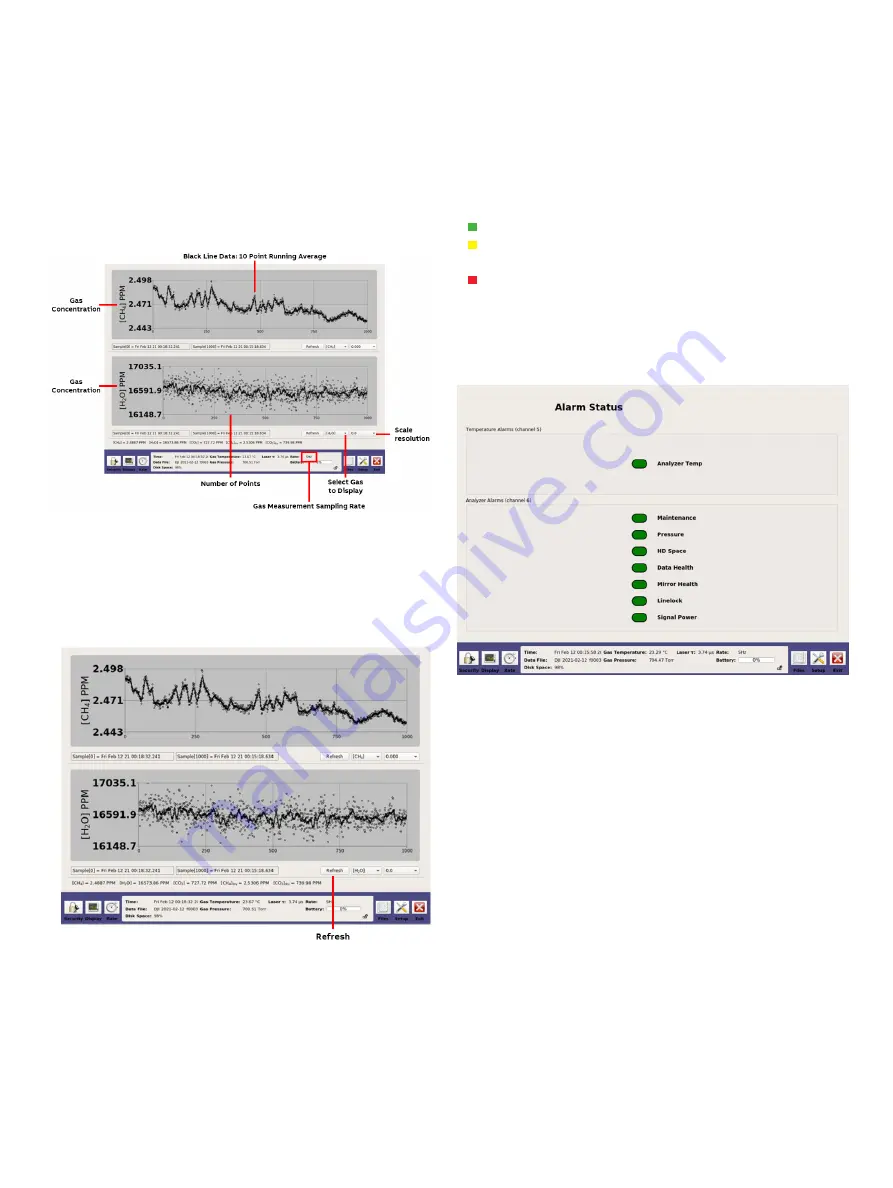
The
Timechart display (Figure 24) provides the absorption (in
ppm) of the sample gas measured . The black line represents the
trace of measured concentrations at a customizable interval
rate .
Figure 24 Spectrum Display Screen
Figure 25 Timechart Refresh Display
Figure 26 Alarm Status Display
The
Refresh
button in the
Timechart display (Figure 25)
refreshes the screen to display the sampling data with a new
starting point .
Alarm Status Display
The
Alarm Status display (Figure 26) indicates the real-time
analyzer operational status . The status uses traffic-light color
indication .
• Green indicates no problem .
• Yellow indicates the analyzer is out-of-spec or maintenance
is soon required .
• Red indicates there is a problem, and maintenance is
immediately required .
Error messages for each alarm can be displayed by selecting
the relevant alarm button: After the button is selected, a pop-
up window appears displaying the messages .


