


LabQuest
®
3 User Manual
www.vernier.com/labq3
31
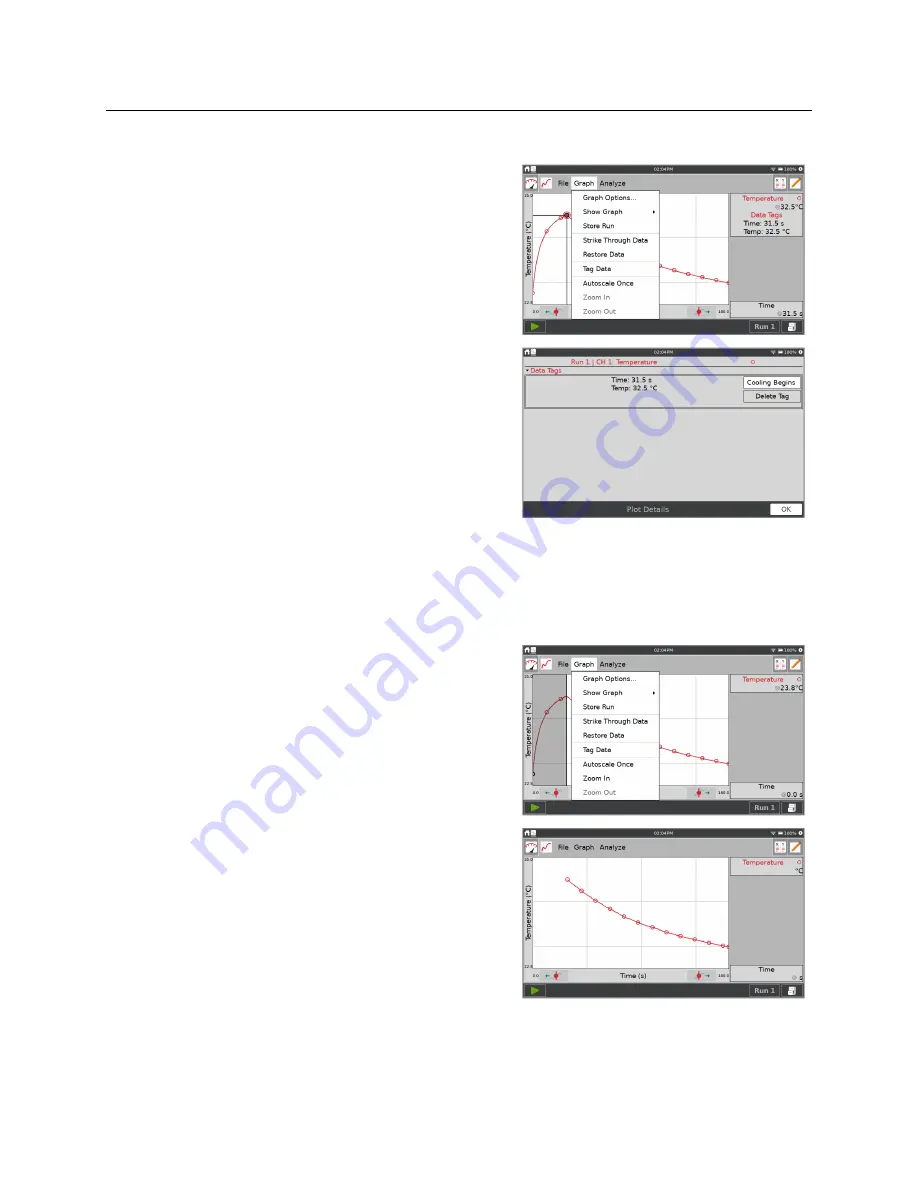
Tag Data
Use the tag data tool to tag a data point with a
comment for later reference.
Tap a point you wish to tag, then choose Tag Data
from the Graph menu to tag that point. The tagged
point is indicated with a large circle or square. Repeat
as needed.
To add comments, tap in the panel to the right of the
graph and enter a comment into the blank field.
TIP!
Tag Data does not work for manually entered
data. If more than one run is plotted on the graph,
only the point from the most recent run is tagged.
Excluding Data from Analysis (Strike Through Data)
While you cannot delete data collected from sensors, you can exclude some data points from
the analysis. This option is called Strike Through Data. You can access Strike Through Data
from the Graph or Table menu.
Tap on a data point or touch-and-drag to select a
region of data that you wish to strike. The data can be
selected from either the graph or the table.
Choose Strike Through Data from either the Graph or
Table menu.
The struck data no longer appear on the graph.


