


Using the LabQuest
®
App
30
Vernier Software & Technology
Analyzing Your Data
Most data analysis can be done from the Graph screen. Analysis can include examining data on
the graph, calculating statistics, modeling with automatic or manual curve fits, and doing a FFT
analysis of your data. The results of your analysis are shown in the plot details box to the right
of the graph. Tap the box to view the results in a full screen.
To remove an analysis from your graph, select it again.
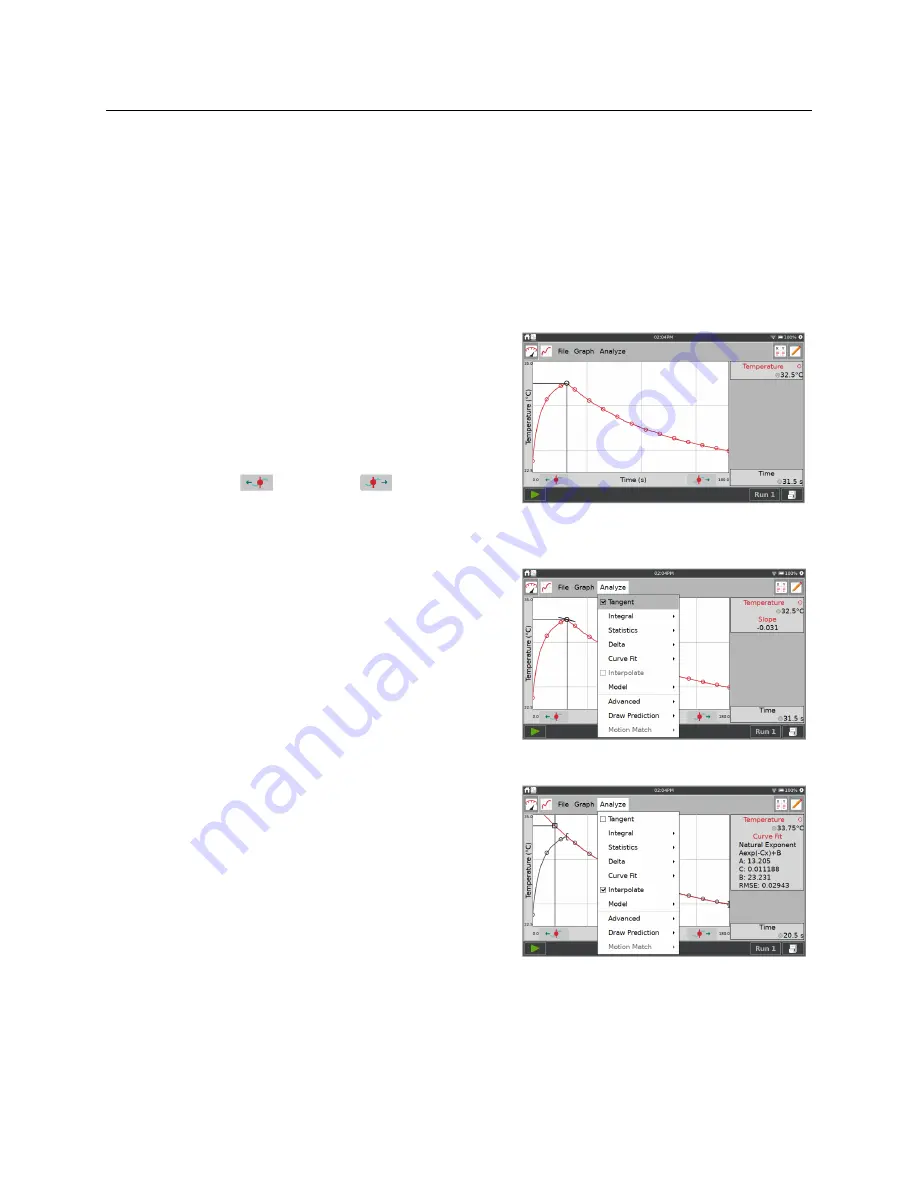
Examining the Data
To examine data on the Graph screen, tap on a data
point of interest. The Examine cursor jumps to the
data point with the nearest x-value. Cursor lines
highlight the x- and y-axis values and the coordinates
are displayed to the right of the graph.
You can make fine adjustments to the cursor location
by using the Left,
, and Right,
, examine
buttons.
Tangent
The Tangent mode enhances the Examine cursor by
adding a tangent line and numeric display of the slope
as you tap different locations on the graph. Choose
Tangent from the Analyze menu to activate this tool.
Interpolate
When you have performed a curve fit, you can use the
Interpolate tool to examine points on the fitted
function. Choose Interpolate from the Analyze menu
to activate this tool.
The Examine cursor locates a position on the fitted
function instead of a data point. Coordinates are
shown to the right of the graph.
TIP!
When using Interpolate, the examine cursor is a square instead of a circle, the data points
and connecting lines are gray, and the curve fit is drawn in color
.


