


Using the LabQuest
®
App
22
Vernier Software & Technology
Reversing the Sensor Reading
Some sensors read both positive and negative values.
For example, force sensors by default read positive
values when pulled, and negative values when
compressed.
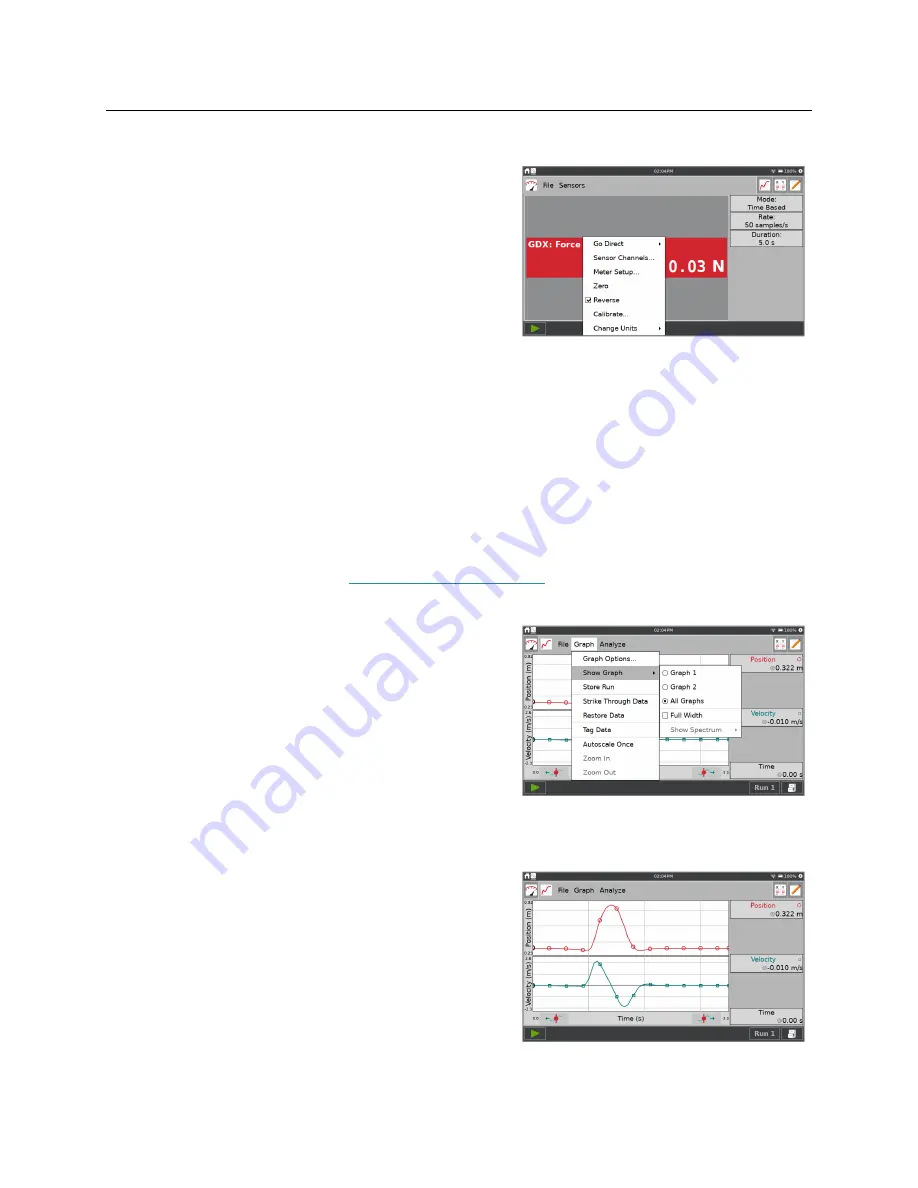
Tap the meter and choose Reverse to swap the sign of
the reading with respect to the default sensor reading.
Not all sensors can be reversed.
Setting up Graphs
The default graph configuration is based on the connected sensor(s) and the selected data-
collection mode. You can change the default behavior as desired. Changes to the graph can be
made either before or after data collection.
One or Two Graphs
The number of graphs displayed is determined by the connected sensors. While most sensors
typically only show one graph, some sensors, such as the motion detector, show two graphs by
default. When using multiple sensors, sensors with different units are plotted on separate axes
whenever possible. Sensors (and
Go Direct Sensor Channels
) added prior to data collection are
plotted automatically.
You can change the number of graphs displayed from
the Graph screen. Choose Show Graph from the Graph
menu and select the desired Graph configuration.
Full Width
—This option displays the graph(s)
using the full width of the screen by hiding the
graph details displayed to the right of the graph.
Show Spectrum
—When using a spectrometer, you
can control the color background shown on the
graph to be full screen, a narrow strip, or not
shown.
When two graphs are displayed, the graphs have a
common x-axis. While you can change the associated
data column and scaling of the independent axis, the
change applies to both graphs.


