Getting Started
DME Admin Guide
31
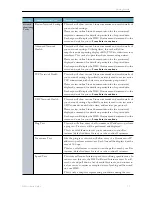
This is a snapshot of the aggregated
CPU Use
. The field’s background color
will change indicating its health status. The available statuses are: Normal (0%-
70% CPU usage), Warning (71%-80%), and Alert (> 80%). As a snapshot, this
is a transient measure that may self-correct. These thresholds are applied on
snapshots and represent hard cut-offs between the status – please consider
your use cases, the status, and the actual measure within the status to help
determine if action is necessary.
Guidance
: A DME, depending on load may bounce into and out of a Warning
or Alert stages during the normal course of use. If your DME is constantly
running in Warning, you should consider and monitor the CPU if you are
planning to add additional CPU intensive configurations (such as Stream
Conversion / transrating). If your DME bounces into an out of Alert, but does
not remain in that state for more than 1 refresh of the Status Bar, action may
not be necessary but as a cautionary measure you may wish to monitor the use
and playback experiences. If your DME is consistently reporting in Alert
status, then please evaluate your configuration and load. Particularly, watch the
MPS monitor page for stream packet loss which may indicate that the DME is
running too hot. The Critical alert is a range, so the higher it goes the more
drastic intervention Linux will take to keep the system running.
Snapshot of current
MPS
(only) throughput and is measured in accordance to
the allowable limit for the DME license. The field’s background color will
change indicating its health status. The available statuses are: Normal (0%-60%
throughput usage), Warning (61%-90%), and Alert (> 90%). As a snapshot, this
is a transient measure that may self-correct. These thresholds are applied on
snapshots and represent hard cut-offs between the status – please consider
your use cases, number of current streams IN/OUT, the status, and the actual
measure within the status to help determine if action is necessary.
Guidance
: A DME, depending on load may bounce into and out of a Warning
status during the normal course of use. If your DME is constantly running in
Warning, you should consider your distribution configuration against available
licensed throughput. If your DME bounces into an out of Alert you may wish
to actively monitor the use and playback experiences. If your DME is
consistently reporting in Alert status, then please evaluate your configuration
and load. Particularly, investigate the IN/OUT configuration of streams,
number of attaching DMEs/players, and watch the MPS monitor page for
stream packet loss which may indicate that the DME is running too hot.
Snapshot of current
HTTP, HTTPS and caching (only) throughput
.
Hovering your mouse over this field will provide detailed measures for in/out
traffic and local cache use. These measures are averaged over 5 minutes.
Note: Unlike the other measures, this measure is not compared to thresholds
and does not report a health status or color.
Countdown until the Status Bar values are refreshed automatically by the DME.
Refresh
link to refresh them manually. If the Status Bar does not automatically
refresh, you may also refresh the whole page using your browser refresh.
Status to denote if the DME is linked to Rev and if the Rev interface is running.
If either of these is Red, it indicates a problem connecting with Rev. Please
check your Rev Interface page.
Summary of Contents for dme
Page 1: ...Vbrick Distributed Media Engine vbrick dme v3 21 0 Admin Guide March 2019 ...
Page 12: ...xii Preface ...
Page 20: ...8 Vbrick Systems Inc ...
Page 22: ...10 Vbrick Systems Inc ...
Page 54: ...42 Vbrick Systems Inc ...
Page 156: ...144 Vbrick Systems Inc ...
Page 160: ...148 Vbrick Systems Inc ...
Page 176: ...164 Vbrick Systems Inc ...
Page 180: ...168 Vbrick Systems Inc ...
Page 194: ...182 Vbrick Systems Inc ...
Page 202: ...190 Vbrick Systems Inc http dme_ip_address HDS masterplaylistname manifest f4m ...
Page 208: ...196 Vbrick Systems Inc ...


