© 2011 Thorlabs
42
Thorlabs Beam 4.0
Cursor mode
: If the mouse position is near to the vertical cursor line, the
mouse cursor changes to
. The cursor line can be moved with the left mouse
button pressed to a position inside the diagram. The current values at the
cursor position are shown in a rectangle next to the cursor in the colors of the
plotted curve.
Below the individual plot windows are explained in detail.
3.3.2.5.1 Plot Positions
Toolbar:
Menu bar: Windows -> Plot Positions
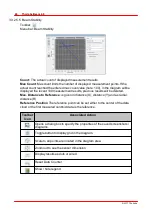
The positions of X and Y peak and of X and Y centroid positions can be displayed
vs. time.
Toolbar
Icon
Associated Action
Opens a dialog box to specify the properties of the saved screenshots /
diagrams.
Toggle button to display grid in the diagram.
Auto scale
Show or hide the cursor
Summary of Contents for BC106-UV
Page 1: ...2011 Operation Manual Thorlabs Beam Beam Analyzing Software BC106 VIS BC106 UV ...
Page 2: ...Version Date 4 0 11 04 2011 2011Thorlabs 2011Thorlabs ...
Page 76: ... 2011Thorlabs 74 Thorlabs Beam 4 0 Example ...
Page 157: ... 2011Thorlabs 155 Appendix 7 4 4 Drawings 7 4 4 1 BC106 UV ...
Page 158: ... 2011Thorlabs 156 Thorlabs Beam 4 0 7 4 4 2 BC106 VIS ...
Page 159: ... 2011Thorlabs 157 Appendix 7 4 4 3 BC1M2 Mounting Adapter ...
Page 160: ... 2011Thorlabs 158 Thorlabs Beam 4 0 7 4 4 4 Translation Stage VT 80 ...
Page 167: ......


