background image


258

You cannot move a cursor off the graticule unless you are in Zoom mode. Also, if you resize 
waveforms, the cursors do not track. That is, a cursor stays at its screen position, ignoring changes 
to horizontal and vertical scale and position and vertical offset (Waveform and Screen cursors will 
track a waveform vertically).  

Cursors Ignore the Selected Waveform 

Each cursor measures its source, defined in the Cursor Setup control window. Selecting a 
waveform for scaling on screen (by pushing the CH 3 front-panel button, for example) does not 
change the source that each cursor measures.  

After you have selected the source from the Cursor Setup control window, you can operate the 
cursor from the front-panel knobs and buttons.  

Note 

If a cursor readout does not seem correct, check the source of each cursor in the Cursor Setup 
dialog box. Each cursor readout relates to the amplitude and time base settings of its source. 

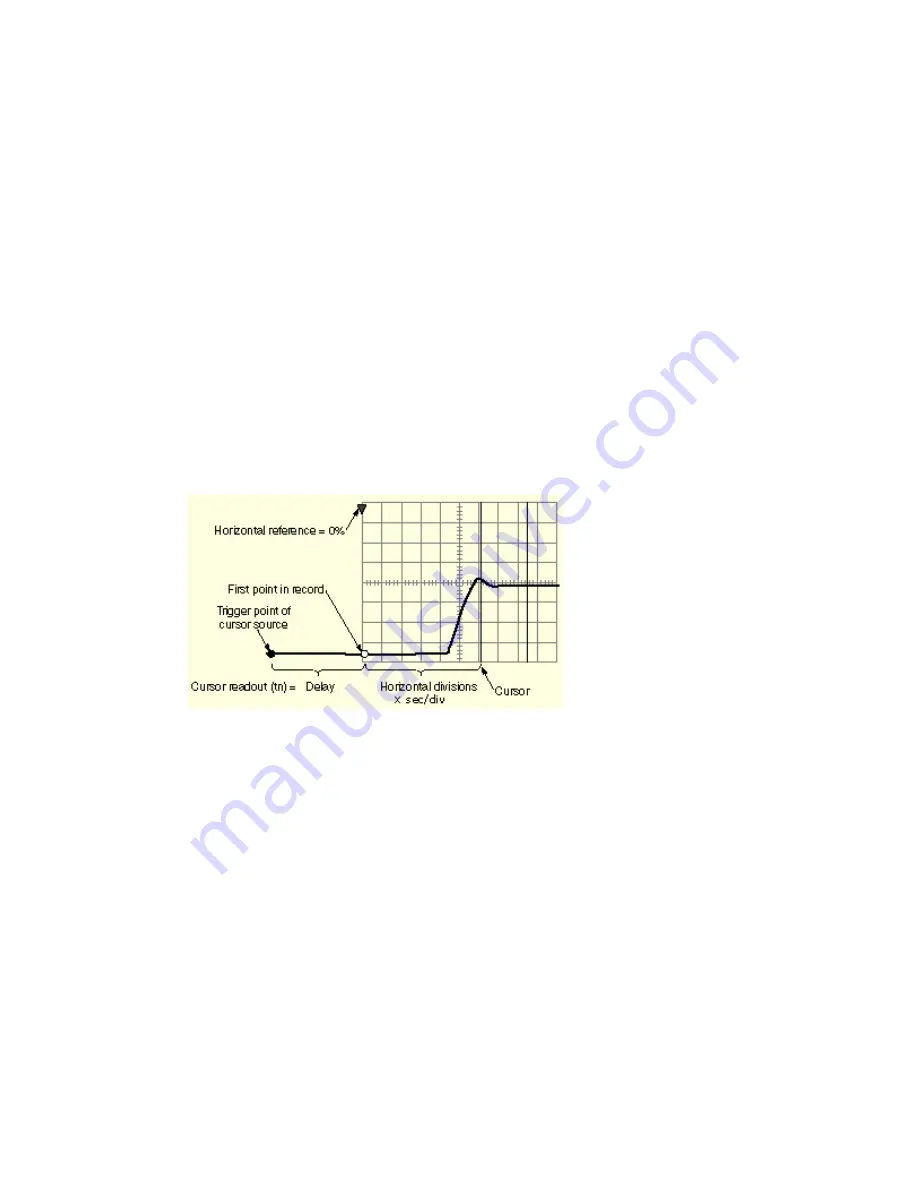
Vertical Cursors Measure from the Trigger Point 

Remember that each vertical cursor measures the time from the trigger point to itself. This 
relationship is shown in the following figure. 


Note that a vertical cursor readout includes and varies directly with the Delay time, which varies 
directly with the horizontal position set for the time base. To see the amount of time to the first 
point, set horizontal delay to 0.0 and set the horizontal reference point to 0%. Now the horizontal 
position readout shows the time following the first point, and adding this value to the cursor 
readout yields the cursor position on screen relative to first point. (You can find the horizontal 
readout both in the control window and in the readout at the bottom of the screen.) The following 
relationships hold: 

Time from First Point = Horiz. Position (when Horiz. Delay and Ref Position are zero) 

T1 readout = Time to First Point + Additional Time to Cursor  

Summary of Contents for TDS5000B Series

Page 1: ...Online Help TDS5000B Series Oscilloscopes PHP0237 Adapted from the TDS5000B Series Oscilloscopes online help Version 2 0 August 2004...

Page 2: ...30 Documentation 31 Support Information 32 Feedback 33 Standard Accessories 34 Recommended Accessories 35 Options 38 Windows Interface Guidelines 39 Analysis and Connectivity Support 40 Getting the A...

Page 3: ...Instrument 46 Choosing and Connecting Probes 46 Creating Your Own Control Windows 47 Triggering Timebase and Horizontal Delay 47 Looking at Waveform Details 47 Using Fast Acquisition and DPO 48 Using...

Page 4: ...tional Touch Screen 63 On Standby Switch 63 File Menu Reference Waveform Controls 64 Save As Dialog Box Waveform 64 Recall Dialog Box Waveform 65 Save As Dialog Box Instrument Setup 66 Recall Dialog B...

Page 5: ...Zoom Control Window 81 Waveform Display Control Window 81 Waveform Label Control Window 82 Position Scale Control Window 82 Position Scale Control Window Position 83 Position Scale Control Window Scal...

Page 6: ...ntal Acquisition Menu Horizontal Acquisition Setup Control Window Horizontal Tab 96 Record Length 96 Horizontal Scale 97 Horizontal Control Window Readouts 97 Horizontal Delay and Horizontal Position...

Page 7: ...nt Settings 108 Incompatible Acquisition Features 109 Sampling Modes 109 FastFrame Setup Control Window 111 Frame Setup 112 Frame Viewing 113 Time Stamps 114 Time Stamp Table 114 Using FastFrame Acqui...

Page 8: ...dow 129 Communication Trigger Codes and Standards Option 130 Set to 50 with Comm Triggers 132 Trigger on A Only Horizontal Delay Off 132 Trigger on A Only Horizontal Delay On 132 Trigger After Time Ho...

Page 9: ...144 Display Setup Control Window Colors Tab 144 Color Palettes 145 Display Palette 146 Reference Color 146 Math Color 147 Text Properties Control Window 147 Display Persistence Control Window 148 Curs...

Page 10: ...t Control Window 162 Measurement Statistics Control Window 163 Reference Levels Control Window 164 Gating Control Window 165 Histogram Control Window 166 Delay Measurement Setup 167 Phase Measurement...

Page 11: ...sk Autoset Vertical Controls 182 Mask Autoset Horizontal Controls 182 Mask Autoset Trigger Level Control 183 Mask Autoset Autofit Control 183 Mask Autoset Mode 183 Mask Configuration Autofit Control W...

Page 12: ...dow 198 Time Domain Tab 199 Spectral Analysis Freq Tab 200 Measurement List Meas Tab 200 Variable List Var Tab 200 Edit Controls 201 Adjust Math Parameters Control Window 201 Math Variables Control Wi...

Page 13: ...ow 216 LAN Server Status Control Window 216 External Signals Control Window 217 Touch Screen Option 217 Instrument Calibration Control Window 218 Instrument Diagnostics Control Window 218 E mail on Ev...

Page 14: ...Acquisition Window Interrelated Parameters 232 Independent versus Shared Window 233 Acquisition Hardware 234 Sampling Process 234 Sampling Modes 235 Waveform Record 235 Interleaving 236 Triggering Co...

Page 15: ...Off 245 Triggering with Horizontal Delay On 246 Triggering and Horizontal Delay Summary 247 Display Overview 247 Display Elements 248 Acquisition Preview 249 Waveform Display 249 Customizable Display...

Page 16: ...269 Using the Frequency Domain Controls 270 Using the Magnitude Controls 271 Using the Phase Controls 273 Using Spectral Analyzer Windows 274 Gaussian Window 276 Rectangular Window 277 Hamming Window...

Page 17: ...iasing 294 Eliminating Aliasing 295 Nyquist frequency 295 Overview Tasks Setting Up Signal Input 296 Setting Acquisition Modes 297 Setting Up Roll Mode 297 Using Fast Acquisitions 299 Time Stamping Fr...

Page 18: ...Localizing a Measurement 326 Setting Cursor Sources 326 Starting and Resetting Histogram Counting 327 Creating a Math Waveform 329 Using Math Waveforms 330 Using a Predefined Spectral Math Waveform 33...

Page 19: ...sor Measurements 355 Creating Reference Waveforms 356 Saving Reference Waveforms using Auto Increment File Name 356 Recalling Reference Waveforms 357 Recalling a Template Waveform 357 Creating a Spect...

Page 20: ...nts on Histogram Data 364 Printing the Screen to a Printer 365 Copying the Screen for Use in other Applications 365 Copying Measurements for Use in Other Applications 365 Saving Instrument Setups 366...

Page 21: ...ng Channel Waveforms 371 Connecting Probes 371 Adjusting Display Contrast 371 Using Mask Testing with Option SM 372 Creating a User Mask with Option SM 372 Saving Masks 373 Recalling Masks 373 Editing...

Page 22: ...t FAR 52 227 19 as applicable Tektronix products are covered by U S and foreign patents issued and pending Information in this documentation supercedes that in all previously published material Specif...

Page 23: ...mode and toolbar mode by clicking Buttons or Menu in the upper right corner of the screen The instrument is also fully compatible with a wide range of PC hardware and software accessories such as netw...

Page 24: ...l built in measurement capability including histograms automatic measurements and measurement statistics Basic math as well as advanced equation editor and spectral analysis A large 10 4 inch 264 2 mm...

Page 25: ...inst industry standard masks Limit Testing Use Limit Testing for pass fail comparison with an active signal Display Features Color LCD Display Identify and differentiate waveforms easily with color co...

Page 26: ...inimize the instrument application and take full advantage of the built in PC to run other applications Moving waveform images and data into other applications is as simple as a copy paste operation D...

Page 27: ...installing new software Support Software The TDS5000B Series Product Software CD ROM included with the instrument contains additional software and files that may be useful to you Readme file This text...

Page 28: ...28 User Interface Map See the figure below for a description of the elements of the user interface These elements provide complete control of the instrument...

Page 29: ...ware The TDS5000B Series Product Software CD ROM contains accessory software and files that you can install on the instrument or another PC Refer to the instructions that accompany the CD ROM for inst...

Page 30: ...three tabs Contents Index or Find From the Contents tab click a topic to select it for display and then click the Display button to open the topic From the Index tab when you enter the subject you are...

Page 31: ...ptions for getting data from your instrument into any one of several available analysis tools TDS5000B Series Digital Phosphor Oscilloscopes Specifications and Performance Verification Technical Refer...

Page 32: ...merica contact your local Tektronix distributor or sales office Service Support Tektronix offers extended warranty and calibration programs as options on many products Contact your local Tektronix dis...

Page 33: ...as specific as possible Recommended Information Instrument hardware for example display chassis Application software version Probes Optional Information Your name company mailing address phone number...

Page 34: ...th America Option A0 161 0104 00 Universal Euro Option A1 161 0104 06 United Kingdom Option A2 161 0104 07 Australia Option A3 161 0104 05 240V North America Option A4 161 0104 08 Switzerland Option A...

Page 35: ...sive Probe TCP202 Current Probe CT1 CT2 and CT6 High Speed AC Current Probes CT 4 AC Current Probe 20 kA TCPA300 TCPA400 Series Current Measurement Systems requires TCPA300 TCPA400 style probe AM5030S...

Page 36: ...36 AFTDS Differential Signal Adapter...

Page 37: ...entronics parallel port connector directly If your printer has a DB 25 connector use the adapter cable that came with your printer For information on printer usage see Using Print Screen Rackmount For...

Page 38: ...e DVD TDSET3 Ethernet compliance test software ET3 TDSDDM2 Hard disk drive application software J2 TDSJIT3E Jitter and timing analysis software essentials J3E TDSJIT3 Jitter and timing analysis softwa...

Page 39: ...the instrument If your instrument stops working after you install third party software try reloading the instrument software from the TDS5000B Series Product Software CD ROM If you do not have an ext...

Page 40: ...nstall to support data export for use with data analysis tools These tools ship with the Tektronix instrument that this online help supports You can find them on the product software CD that ships wit...

Page 41: ...nnectivity on any number of PCs TekVISA ActiveX Control TVC The TekVISA Control TVC uses Microsoft Windows ActiveX control technology to simplify access from Microsoft Office and Visual BASIC applicat...

Page 42: ...lication capabilities by simplifying the process of creating and maintaining reports IVI Drivers IVI drivers conform to specifications produced by the IVI Foundation Unlike VXI plug play drivers they...

Page 43: ...scribe features of your TDS5000B Series oscilloscope Even if you are an experienced user you may want to browse through these topics to learn new ways of doing familiar tasks Basic Operations Using th...

Page 44: ...Settings several ways to set numerical parameters As you configure the instrument you may need to set a numerical parameter such as a reference level or delay time There are several different ways to...

Page 45: ...ol windows that appear on the rightmost side of the screen cannot be moved Controlling from within the Graticule Area things you can touch or click in the waveform graticule Use the mouse or your fing...

Page 46: ...s default settings push the front panel DEFAULT SETUP button If data security is important to you use the Tek Secure Erase feature to overwrite all internal waveforms and set up memory with null value...

Page 47: ...elayed If it is not delayed acquisition occurs surrounding the trigger event depending on the amount of pretrigger and posttrigger data that you have selected If you turn on horizontal delay you can d...

Page 48: ...not only the displayed waveform but also the sample density You can choose to see sample density represented in a color palette or as shades of gray or shades of green The DPO display in monochrome gr...

Page 49: ...t into your measurements you can add measurement statistics to calculate the average measurement value the standard deviation and the maximum range of the measurement value Another way to characterize...

Page 50: ...ts Use the TDSDVD software for automatic amplitude and timing measurements Ethernet Compliance Testing Use the TDSET3 software to perform 10 100 1000 Base T Ethernet compliance testing USB2 Signals Us...

Page 51: ...a white background This function saves printer ink while it preserves the color coding of the waveforms and readouts Ink Saver also works with the monochrome print palettes Choose to print a Summary...

Page 52: ...e dockable windows on the second monitor you can have one dockable window open on the main display If you open a seventh dockable window the window that has not been used for the longest amount of tim...

Page 53: ...kit Software options DVD TDSDVD Optical storage analysis software J2 TDSDDM2 Disk drive measurements software JT3 TDSJIT3 Jitter timing analysis with Rj Dj and BER estimation J3E TDSJIT3E Jitter timi...

Page 54: ...representative for details and the most current information To upgrade your instrument order the TDS5UP Upgrade Kit and the appropriate option s from this list You must order at least one option TDS5...

Page 55: ...Service installation of selected options Option 1K K420 oscilloscope cart with mouse accessory tray Option 1R Rackmount kit Option CP2 TDSCPM2 ANSI ITU telecom pulse compliance software Option ET3 TD...

Page 56: ...vertical display parameters of live data channels connected to the vertical inputs Each input channel has identical controls Use the dedicated channel CH n buttons to turn channel displays on and off...

Page 57: ...he waveform which changes the sample density The actual resolution cannot be set directly but is derived and displayed on the horizontal readouts Push the DELAY button to turn on horizontal delay and...

Page 58: ...for the A event Edge trigger Push the button in the SLOPE column to toggle between positive and negative trigger slopes for the Edge trigger The selected trigger slope is lighted These buttons are on...

Page 59: ...General Purpose Controls Use the following controls to do general purpose tasks such as Autoset the instrument print and enable cursors Push the AUTOSET button to automatically set up the instrument...

Page 60: ...has its own TekProbe interface Use the ground GND terminal to connect the instrument to the same ground as the unit under test Rear Panel Connectors The instrument features these rear panel connectors...

Page 61: ...iability rather than connecting the devices serially If the USB mouse locks up disconnect and reconnect the USB connector to restore normal operation If the instrument front panel and or touch screen...

Page 62: ...e the audio ports for stereo microphone input and stereo line output Use the GPIB connector to connect the instrument to a GPIB controller for GPIB operation Use the lower VGA port to obtain the instr...

Page 63: ...ument To adjust the touch screen operation to your personal preferences run the touch screen program from the shortcut on the Windows desktop or select Touch Screen from the Utilities menu Note If the...

Page 64: ...spective dialog boxes Typing a name in the Label text box places the label on the graticule You can move the label on the graticule by clicking and dragging it The label is saved with the Reference wa...

Page 65: ...ft Excel dat Usable by Mathcad and MATLAB txt Standard text file format Note Any characters that you enter in the file name box become part of the file name The instrument does not use any user define...

Page 66: ...a temporary file containing the waveform data is written to C TekScope Waveforms The file is named TDS_REFn WFM where n is the reference waveform number This file is deleted when the reference wavefo...

Page 67: ...nce waveform separate from the instrument setup The instrument preference settings are not saved with the setup They are saved when the instrument power is powered off Note Before saving an instrument...

Page 68: ...ich reference waveforms are used with math waveforms and automatic measurements If you want to save the reference waveform data save the reference waveform separate from the instrument setup You can t...

Page 69: ...nt on the type of printer connected to the instrument A reduced preview image appears at the top of the window To view a larger image click Print Preview at the bottom of the window Click Print when y...

Page 70: ...en so that they appear on hard copies you print To do this toggle the Display Date Time button On from the Display Setup control window Objects tab If you need to reset the date and time for any reaso...

Page 71: ...Save Options dialog box to set the parameters for the waveform that you want to save To Use Select the data format Data destination for the waveform that you want to save Select a valid waveform from...

Page 72: ...ment that you want to save In the Measurement Save Options dialog box select the Measurement Format from the drop down list for the measurement that you want to save Select either Displayed Measuremen...

Page 73: ...More submenu Auto increment file name Select Auto increment file name to save numerous similar files without retyping the entire file name each time Enter a Base file name and click Save For the initi...

Page 74: ...lor Grayscale or Black White Select the type of View To copy an image of the entire screen select Full screen to copy an image of the selected graticule select Graticule s only Select the type of Imag...

Page 75: ...ation takes place after you click Copy If you select Data between cursors another set of cursors may temporarily appear on your screen while the copy is in progress Copy Setup Measurements Access this...

Page 76: ...e undone Parameters that you changed that are not controlled by Autoset retain their settings Behavior The Autoset Undo control window remains on the screen until you open another control window After...

Page 77: ...control window to select the channel you want to change Zoom Setup Control Window Access this control window from the Vertical or Horiz Acq menu Zoom Setup command Overview Use the Zoom Setup control...

Page 78: ...roll tab to scroll the zoomed area s To scroll a single zoomed area select the zoom area 1 4 and then click an Auto Scroll button You can also set the scroll speed To scroll multiple zoomed areas simu...

Page 79: ...drop down list to select the waveform or Zoom area that you want to zoom in on Adjust the Position and Factor controls using the multipurpose knobs Click Setup to display the Zoom Setup control windo...

Page 80: ...You can also set the scroll speed To scroll multiple zoomed areas simultaneously click Lock and then click the zoomed areas 1 4 you want to scroll through This locks the zoomed areas in their relativ...

Page 81: ...orm Display Control Window Access this control window from the Vertical menu Display On Off command Display On Off is also available on the Math menu Overview Use the Waveform Display control window t...

Page 82: ...Behavior The label applies only to the selected waveform Each waveform channel math or reference has its own label If you do not enter a label for the selected waveform the label will be left blank A...

Page 83: ...e To Use Use the Scale control to set the vertical scale value of the selected waveform Click the control to map it to one of the multipurpose knobs and use the knob to move the waveform Behavior Each...

Page 84: ...t control affects the waveform display by defining the channel reference indicator to match the offset rather than the ground level The offset affects only channel waveforms as compared to the positio...

Page 85: ...u restore 1 M coupling the instrument does not return to the vertical scale setting that was reduced because of the 50 selection You must set the vertical scale coupling and termination appropriate fo...

Page 86: ...s to select the bandwidth of frequencies that you want to acquire Behavior The bandwidth refers to the range of frequencies that the instrument can acquire and display accurately with less than 3dB at...

Page 87: ...he probe calibration procedure before taking any measurements with the selected probe Probe Calibration Control Window Probe Status To Use The Probe Status control provides information on the status o...

Page 88: ...gnificant performance improvements when performed with active probes or older passive probes You should perform a probe calibration any time you want to ensure that the measurements you take are made...

Page 89: ...ensates individual channels for probes or cables of different lengths The instrument applies the delay values after each completed acquisition The deskew values which have a range of 75 ns do not affe...

Page 90: ...l or by entering a dB value in the lower control When you return the attenuation to the default value the multiplier returns to 1 and the dB value returns to 0 Display On Off To Use Click Display to t...

Page 91: ...ted POSITION and SCALE knobs on the front panel to control the position and scale of the selected waveform Offset To Use Use the Vertical Offset controls to set the offset value of the selected wavefo...

Page 92: ...V to 10 V from 100 V with a X10 probe attached since the amplitudes appropriate for the higher settings would overload the 50 input The instrument switches to 50 and disables AC coupling and switches...

Page 93: ...ately with less than 3dB attenuation Each input channel has its own bandwidth selection To acquire all frequencies on the selected channel click Full To limit frequencies above 150 MHz click 150 MHz t...

Page 94: ...volt axis No trace of the normal waveform is left on the screen Using Offset to Avoid Clipping Signals Clipping The circled portion of the incoming waveform is clipped and therefore is not acquired T...

Page 95: ...ing to the circuit under test That makes low input impedance passive probes ideal for timing and phase measurements when amplitude accuracy is not a major concern Low input passive impedance probes ar...

Page 96: ...ion controls are common to all channels The Horizontal tab controls manage the horizontal setups such as scale and position Normally the horizontal axis displays time information However in some cases...

Page 97: ...ntrol window to change the horizontal scale and position of reference waveforms within the Zoom window s When the horizontal delay is off the scale expands or contracts around the trigger point When t...

Page 98: ...o specify the amount of pretrigger data The reference point is represented on the screen by a small inverted triangle Use the dedicated DELAY button to turn the Horizontal Delay on and off Or use the...

Page 99: ...er event To acquire waveforms leading up to the trigger event set the horizontal position control to the maximum time setting To acquire waveforms after the trigger event set the horizontal position c...

Page 100: ...o set the delay time You can also use the dedicated HORIZONTAL POSITION knob on the front panel Behavior Use the Horiz Delay control to delay the acquisition relative to the trigger event The horizont...

Page 101: ...ess this control window from the Horiz Acq menu Resolution command Overview Use the Resolution control window to select the number of samples per division for all acquired waveforms To Use Use the mul...

Page 102: ...base mode select the number of samples using the multipurpose knob Behavior In Sample mode the instrument creates a record point by saving one or more samples during each acquisition interval Sample m...

Page 103: ...ode Unlike Peak Detect mode the peaks are gathered over many trigger events After each trigger event the instrument acquires data and then compares the minimum and maximum values from the current acqu...

Page 104: ...t creates a digital representation of the input signal by sampling the voltage level of the signal at regular time intervals The sampled and digitized points are stored in memory along with the corres...

Page 105: ...dless of the input signal The following table indicates that you can obtain up to 15 significant bits with Hi Res mode Note that the resolution improvements are limited to speeds slower than 40 ns div...

Page 106: ...ront panel FastAcq button is lighted If Fast Acquisitions mode is on and you attempt to activate a feature that conflicts with this mode Fast Acquisitions mode will be inhibited When the conflicting f...

Page 107: ...y When Roll mode is enabled the instrument displays newly acquired data points at the right edge of the display while moving the older waveform data points to the left Using single sequence with roll...

Page 108: ...ment settings If Roll mode is on and you turn on Fast Acquisitions Roll mode will be suppressed until you turn Fast Acquisitions off If Roll mode is on math waveforms and measurements are updated only...

Page 109: ...ing these acquisition modes will turn Roll mode off Sampling Modes To Use To enable a sampling mode click the Sampling Mode button There are three sampling modes Real Time Only Interpolated Read Time...

Page 110: ...ger You should only use Equivalent Time mode on repetitive signals The sampling speeds and the number of channels that you choose affect the mode that the instrument uses to sample waveforms in the fo...

Page 111: ...b of the Horizontal Setup control window Control Window Overview Use these controls to capture a series of triggered acquisitions at high resolution without wasting acquisition memory on the dead time...

Page 112: ...ed Frame controls and the Reference Frame controls adjacent to the full screen graticule Select Average or Envelope from the Summary Frame list to replace the last frame with one that is the computed...

Page 113: ...re separate from channel and math waveforms When you set the Selected Frame Source Ch1 to Frame 3 then the Selected Frame Ch2 Ch3 Ch4 Math1 Math2 Math3 and Math4 are also set to Frame 3 When you set t...

Page 114: ...rame and the delta difference between the two frames The time stamps are displayed in a format that shows the date and time The Time Stamps Table displays the current time stamps and readout informati...

Page 115: ...Acq mode also provides exceptionally fast acquisition rates Both modes have advantages FastFrame preserves the actual data associated with each trigger event for further analysis or visual inspection...

Page 116: ...set up the front panel controls based on the characteristics of the input signal This is much faster and easier than manually setting up the controls Note Autoset may change vertical position to posi...

Page 117: ...all If less than 50 set to 100 Display Format YT Horizontal Position Centered within the graticule window Graticule Setting Unchanged AutoBright On Horizontal Scale As determined by the signal frequen...

Page 118: ...etting Vertical Scale As determined by the signal level Vertical Position As determined by the number of active channels Vertical Coupling DC unless AC was previously set AC remains unchanged Vertical...

Page 119: ...f the control window displays details on the trigger type The trigger expression near the top right side of the trigger window provides a one line summary of the conditions that must be fulfilled befo...

Page 120: ...the classes Pattern and State trigger the instrument based on the Boolean operator you select for the trigger sources A third class Setup and Hold triggers when data on one trigger source changes sta...

Page 121: ...gger on the B Event trigger defined by events or time Behavior When you click one of the trigger icons on the display the right side of the screen shows the trigger sequence Set the individual control...

Page 122: ...ultipurpose knob Behavior Use the holdoff time to delay the trigger system for a specified amount of time between triggers You can set the holdoff time to a value that synchronizes the instrument with...

Page 123: ...nd trigger on a glitch or to ignore a glitch Glitches are defined as pulses that are narrower than a specified time The trigger occurs when the instrument detects a pulse outside either less than or g...

Page 124: ...vel threshold controls to set the voltage ranges that define a valid pulse Runt pulses are short pulses that cross one threshold but fail to cross a second threshold before crossing the first threshol...

Page 125: ...limit is measured at the voltage level specified by the Level control Transition Time Trigger Control Window To Use Use these controls to set the Transition Time trigger parameters Behavior Use the Tr...

Page 126: ...If any violations occur the instrument triggers with the trigger point located at the clock edge The setup and hold values can be positive or negative The minimum setup and hold time is 2 ns Negative...

Page 127: ...h4 controls are only available on 4 channel models Logic State Trigger Control Window To Use Use these controls to set the State trigger parameters Behavior Use the Logic State trigger to trigger the...

Page 128: ...o trigger the instrument as the signal is entering or leaving the threshold window You can further qualify the trigger event in terms of time by using the Trigger When Wider option or by the logical s...

Page 129: ...the Custom signal format no Autoset options are available You must set the Scan Type and Scan Rate Also note that you will only be able to specify a value for the Holdoff control in units of time Cli...

Page 130: ...Option Overview The following tables list the Communication Trigger Codes and Standards available with Option SM Note The communication trigger standards available for an instrument depend on the band...

Page 131: ...s FC2125E 2 125 Gb s G1 ATA 1 5 Gb s GB Ethernet 1 25 Gb s FS USB 12 Mb s HS USB 480 Mb s OC1 STM0 51 84 Mb s OC3 STM1 155 5 Mb s OC12 STM4 622 1 Mb s OC48 STM16 2 488 Gb s OC48 FEC 2 666 Gb s S400b...

Page 132: ...m the A Event tab and then set up trigger controls for the A Event Next select the A B Seq tab and click A Only Use the Horiz Position control to define the amount of pretrigger data Behavior When you...

Page 133: ...nt and B Event from their individual tabs Select the A B Seq tab and click Trig After Time Select the trigger delay time with the Trig Delay control Adjust the Horiz Position and B Trig Level controls...

Page 134: ...for the trigger conditions specified by the A event After the A event arms the trigger system the instrument delays the trigger for the period of time specified by the Trig Delay control After the tri...

Page 135: ...tabs Then select the A B Seq tab and click Trig on nth Event Select the number of B events with the Trig Event control Use the Horiz Delay control to delay the acquisition relative to the B event Adju...

Page 136: ...ith the multipurpose knob Behavior When Holdoff is set to Default the holdoff time is based on the time equal to five times the current horizontal scale setting You may want to manually set the holdof...

Page 137: ...Set 50 to set the trigger threshold level of the selected trigger channel to 50 of that channel s amplitude Behavior These controls operate identically to the controls on the front panel Run Stop Cont...

Page 138: ...t contain a valid trigger The instrument recognizes and acts upon the forced trigger even when you click the button before the end of the pretrigger holdoff The button has no effect when acquisitions...

Page 139: ...play such as date and time Display Setup Control Window Appearance Tab Access this control window from the Display menu Display Setup command or Appearance command Overview Use the controls on the App...

Page 140: ...pe Variable persistence accumulates record points on the waveform for a specified time interval Each record point decays independently according to the time interval If you click Off waveform record p...

Page 141: ...ormat is a dot only display although it can have persistence The Vector style selection has no effect when you select XY format XYZ plots the amplitude of one waveform record against the amplitude of...

Page 142: ...is useful for waveforms with fast rise times such as pulse trains Use the Display menu Waveform Interpolation submenu to directly access the interpolation options You may want to set the display styl...

Page 143: ...ule Style To Use Click one of the buttons to select the graticule display grid style Behavior Full provides a grid cross hairs and frame on the instrument display Use Full to make quick estimates of w...

Page 144: ...tipurpose knob to set the delay time before the LCD back light turns off Behavior The LCD Backlight control turns the LCD backlight off after the amount of time in Delay has expired without any screen...

Page 145: ...iew Palette or the Fast Acq WfmDB Palette submenu to directly access the color palettes Behavior Normal displays hues and lightness levels for best overall viewing The color of each channel waveform m...

Page 146: ...ck the Hue Lightness or Saturation text box to adjust the percentage of each of these attributes Click the Source drop down list to select the waveform for which you want to change the color Click Res...

Page 147: ...e To Use Select the line of text from the Screen Text drop down list and then use the X Pos and Y Pos controls to define the location of the text on the graticule Behavior The text from the drop down...

Page 148: ...persistence buttons activates that type of persistence Clicking Off turns all persistence off Clicking Reset clears the accumulated waveform points from the display and restarts the persistence time A...

Page 149: ...cannot display math and reference waveforms in the XYZ format Channels X Axis Y Axis Z Axis Ch 1 Ch 2 and Ch 3 Ch 1 Ch 2 Ch 3 If you only display one or two source channels when you enter XYZ format t...

Page 150: ...or source to be the same for both cursors just set the source for Cursor 1 Cursor 2 will have the same value as Cursor 1 unless you change it Click the Cursor Positions controls to map the cursors to...

Page 151: ...panel CURSORS button Cursor Type Setup Control Window Access this control window by pressing the CURSORS front panel button clicking the Cursors toolbar button or selecting the Cursor Controls comman...

Page 152: ...tton to assign the multipurpose knobs to the X axis and the Y axis Cursor Position Control Window Access this control window from the Cursors menu Cursor Position command Overview Use this Cursor Posi...

Page 153: ...nnel Selector tabs to select the waveform that you want to measure Behavior Vertical bar cursors measure horizontal parameters Typically horizontal parameters are in time or frequency The cursor reado...

Page 154: ...o measure Behavior Use screen cursors to indicate an arbitrary X and Y position in the waveform display area represented by the intersection of a vertical and horizontal cursor line Screen cursors mea...

Page 155: ...orizontal position is shown by a vertical line the Y axis is shown by an X Default style for Waveform cursors in YT mode X Waveform and Screen XY Single X indicates the horizontal and vertical positio...

Page 156: ...sors are enabled changes the cursor type to Waveform In FastAcq acquisition mode changing the display format to XY when V Bar cursors are enabled changes the cursor type to Screen If you change the di...

Page 157: ...Y X1 x Y1 and X2 x Y2 Ratio shows the cursor position as rectangular coordinates and the Y vertical value is divided by the X vertical value Waveform cursors display six ratio readouts Y X Y1 X1 Y2 Y1...

Page 158: ...urements on the selected waveforms Create a list of measurements to appear in the main graticule or in a separate measurement window Define unique the reference levels for each measurement Use gating...

Page 159: ...de submenu Measurement Tabs Time To Use Use the Time tab to select automatic time measurements Select a source channel from the Channel Selector tabs and click a measurement button to add the measurem...

Page 160: ...ter the parameters for the phase measurement and click Ok to return to the Measurement Setup control window The phase measurement is added to the list Select the individual measurements directly from...

Page 161: ...for the Comm measurement to work Select the individual measurements directly from the Measure menu Measurement Tabs Communications More To Use Use the Comm tab to select communications measurements a...

Page 162: ...asurement hold the left mouse button and drag the mouse to the last measurement and then select a new channel from the Source control Similarly you can change all of the measurements from one type to...

Page 163: ...s display off Click Mean to display the value and the mean of each measurement Click All to display all statistics for each measurement value mean minimum m maximum M standard deviation and population...

Page 164: ...centage click the Percentage button Click either Eye or Pulse to select the signal type Behavior The following reference levels are included High Reference Mid Reference Low Reference and Mid2 Referen...

Page 165: ...imit measurements to a specific portion of the waveform You can limit gating to the region bounded by the vertical bar cursors or to the left and right edges of a Zoom area When you click Zoom 1 4 the...

Page 166: ...number of vertical or horizontal bins Horizontal histograms have a maximum of 500 bins while vertical histograms have a maximum of 200 bins The displayed width or height of the bin that contains the...

Page 167: ...ch Delay direction Click Ok to add the measurement to the measurement list or click Cancel to cancel the measurement and return to the Measurement Setup control window Behavior This timing measurement...

Page 168: ...urn to the Measurement Setup control window Behavior This measurement is the amount of time one waveform leads or lags another waveform Phase is expressed in degrees where 360 comprise one waveform cy...

Page 169: ...er than a User mask Mask Types and Standards Option Overview The following tables list the Mask Types and Standards available with Option SM Note The standards available for an instrument depend on th...

Page 170: ...X UTP 125 Mb s Gigabit Ethernet 1 25 Gb s 1000B CX Norm TP2 1 25 Gb s 1000B CX Abs TP2 1 25 Gb s 1000B CX Abs TP3 1 25 Gb s XAUI Near 3 125 Gb s XAUI Far 3 125 Gb s 1000B SX LX 1 25 Gb s SONET SDH mas...

Page 171: ...3E Abs Gamma Recv FC2125E Norm Beta Transm FC2125E Norm Delta Transm FC2125E Norm Gamma Trans FC2125E Abs Beta Transm FC2125E Abs Delta Transm FC2125E Abs Gamma Transm FC2125E Abs Beta Recv FC2125E Ab...

Page 172: ...1 5 Gb s Rcv 2 0 Gb s Rapid IO Serial masks None RIO Serial 1 25 Gb s RIO Serial 2 5 Gb s RIO Serial 3 125 Gb s IOF masks none SFI SPI 5 TA Data 2 488 Gb s SFI SPI 5 TC Data 2 488 Gb s SFI SPI 5 TA C...

Page 173: ...cess the Autofit or Autoset Configuration control window Behavior Clicking the Autoset control causes the instrument to automatically align the mask based on the characteristics of the input signal Th...

Page 174: ...channel number it is used as the source for mask testing You can select only one source at a time for mask testing Mask Margins Control Window To access this control window select Tolerance Setup from...

Page 175: ...asks menu Overview Use this control window to set the parameters for passing or failing the mask test to set the test notification mode to select the polarity for testing and whether to repeat the tes...

Page 176: ...l Thresh text box the test has failed If the failed waveforms or samples are less than the number in the Fail Thresh text box the test passes The instrument begins sampling after the number of seconds...

Page 177: ...mail on mask failure on Click Setting to set up e mail on event if you have not already done so Click the Save Wfm control to turn the save waveform function on and off Click the Log Date control to t...

Page 178: ...Click the On Off control to start the test Click the Controls button to open the Mask Test Controls control window Behavior When the Repeat control is on the test runs continuously When the On Off con...

Page 179: ...ssed in green and failed in red Total Hits indicates the total number of data points that violated the mask Failed Wfms shows the total number of waveforms that failed during the test sequence Mask Hi...

Page 180: ...orms Tested fields are reset to zero Mask Test Controls Control Window Access this control window by clicking the Controls button on the Pass Fail Results Setup control window Overview Use this contro...

Page 181: ...ning on Highlight Hits displays the hits in a different color so they can be easily seen When you click the Mask button this window closes and the Mask Setup control window opens Mask Configuration Au...

Page 182: ...f Behavior Turning on the Scale Position or DC compensation sets these vertical adjustments up to be performed on an autoset Mask Autoset Horizontal Controls Overview Use these controls to choose whet...

Page 183: ...s performed Behavior When Autofit is turned on the waveform is autofitted once at the end of every autoset Autoset will take longer but hits will be minimized Autofit will only move the signal if ther...

Page 184: ...sk Setup control window Behavior The maximum level of adjustment determines how far Autofit will search for the best fit to minimize hits For example if you set the Vertical Maximum to 10 div Autofit...

Page 185: ...control window Click the Copy Current Mask to User Mask to make the current mask a user mask Behavior Clicking the User Mask control gives you access to the User Mask in the standard drop down list C...

Page 186: ...r decrease the vertex by 1 To set a specific number click the Vertex text box to activate the pop up calculator Clicking the Add button adds a point to the boundary in the selected segment and just af...

Page 187: ...name of the mask file that you want to recall to select it and then click Recall You can also click the keyboard icon to access the pop up keyboard and enter the file name Behavior The Recall dialog...

Page 188: ...ame click Save To enter a different file name click the keyboard icon and use the pop up keyboard to enter a unique file name The extension specified in the Save as type list will automatically be app...

Page 189: ...ent number by one The Vertex up and down arrows increase or decrease the vertex by 10 To set a specific number click the Vertex text box to activate the pop up calculator Clicking the Add control adds...

Page 190: ...sing the multipurpose knobs or the pop up keypad Your template waveform will be smoother if you use Average acquisition mode to acquire it Use Envelope acquisition mode to create template waveforms th...

Page 191: ...can perform more than one limit test at a time Behavior The Source drop down list contains the following choices Ch1 Ch4 Math Math4 and Ref1 Ref4 only Ch1 Ch2 Math1 Math2 and Ref1 Ref2 are available...

Page 192: ...turn it on Behavior Clicking the Config button under Failure Notification activates the Failure Notification control window You can choose one or more actions that you want your instrument to take if...

Page 193: ...trument sends a screen print to the default printer The current page setup is used for the screen shot There is no specific page setup for limit test failures When Save Wfm is turned on and a limit te...

Page 194: ...n the limit test on or off Click Reset to clear the status and highlighted hits Behavior When you turn the limit test on the status will indicate either Passing or Failing When the test is turned off...

Page 195: ...location Select the Source from the drop down list and then select one of the four reference locations Click Save To save to a file click the keyboard icon to enter a file name or select Auto increme...

Page 196: ...change the vertical position and scale of a math waveform click the waveform handle on the left side of the screen Use the multipurpose knobs to change the waveform position and scale Math Waveform P...

Page 197: ...s create math waveforms that are the product of the two input waveforms For example you can obtain a power waveform by multiplying a voltage waveform by a current waveform Note The Ch3 Ch4 and Ch3 Ch4...

Page 198: ...l waveform from math or reference waveforms Click Mag to create a spectral magnitude waveform Click Phase to create a spectral phase waveform Equation Editor Control Window Access the Equation Editor...

Page 199: ...expression using the Text Edit controls To edit another math waveform select the waveform from the Math n drop down list in the Equation Editor control window Time Domain Tab To Use Use these control...

Page 200: ...nt List Meas Tab To Use Use the list to enter one of the predefined measurements into the math expression Click the button adjacent to an item to insert the measurement into the expression Behavior Th...

Page 201: ...Math menu Overview Use this control window to specify the number of times the selected math waveform is averaged To Use Click the Mathn control to map it to one of the multipurpose knobs Then use the...

Page 202: ...Access this control window from the Math menu Spectral Setup command or by clicking Spect in the Adjust Math Parameters control window Overview Use these controls to set up a math waveform for spectra...

Page 203: ...the waveform without closing the control window Click OK to apply the changes and close the control window Mag Scale Tab To Use Use these controls to specify the vertical scale for magnitude waveforms...

Page 204: ...degrees or radians To set a dB level for the suppression threshold select dB scale from the magnitude tab and then set a horizontal bar cursor to the level on the magnitude spectrum Read the dB value...

Page 205: ...remains constant Note The acquisition controls interact with the gating and frequency domain controls changing one set of controls may change some of the other control settings Spectral Setups Gating...

Page 206: ...tral Setups Frequency To Use Click the individual controls and use the multipurpose knobs to select the Center Freq Freq Span and Res BW Click Full to set the frequency span to full Behavior The maxim...

Page 207: ...math waveform Sample Rate is the number of acquisition samples per second The faster the sample rate the more accurately the instrument can represent fine details in a fast signal The sample rate det...

Page 208: ...point of the gated data Gate Dur Gate Duration sets the gate time duration in seconds The default gate duration is the duration of the entire waveform record The resolution bandwidth is inversely pro...

Page 209: ...the position with respect to the reference marker Note The Frequency domain controls interact with the Gating and Acquisition controls changing one set of controls may change the other control settin...

Page 210: ...e is determined by the window function Some windows have better resolution bandwidth but they do so at the expense of side lobe attenuation and energy leakage into adjacent bins For example a rectangu...

Page 211: ...Click a control to preview it in the pane at the right Double click the control or click the to expand the control list If there is no then the control cannot be customized further Clear the check box...

Page 212: ...readouts that are not available in the MyScope window are Resolution Sample Rate and Duration Trigger controls Trigger Type and Trigger Sequence controls have a setup button that is automatically incl...

Page 213: ...ssign the same measurements to multiple channels Each page of the measurement controls can hold up to 12 measurements If you select more than twelve a More button appears to accommodate the multiple p...

Page 214: ...ing Open will open the selected MyScope control window The only available file type is tcw Save MyScope File As Dialog Box To Use Type a file name in the File name text box and click Save To save to a...

Page 215: ...them to the multipurpose knobs and use the knobs to set the time and date Click Set time and date now to save your changes You can also click Get current time to set the time using the system clock T...

Page 216: ...e instrument is defined as a GPIB talker listener when you click Talk Listen This is the device based operation The instrument is defined as a controller when you Click Controller This is the controll...

Page 217: ...elected trigger signal is routed to the AUX OUT BNC connector so that you can trigger another instrument such as a logic analyzer The output voltage is TTL compatible negative polarity For External Re...

Page 218: ...brations the Status control should indicate Pass If it does not contact your local Tektronix service personnel Instrument Diagnostics Control Window Access this control window from the Utilities menu...

Page 219: ...ton to open the Save Options dialog box and set the parameters for the attachment Enter the number of e mail messages to be sent by the instrument up to a maximum of fifty in the Limit text box Enter...

Page 220: ...ng e mail on events You must have a server entered in the SMTP Server Address box for your instrument to send e mail You can customize your e mail by selecting the number of attempts to make entering...

Page 221: ...mand Overview Use the Prompt Before Action tab to indicate whether or not you want the instrument to display prompts confirmation messages before carrying out certain tasks like deleting files or wave...

Page 222: ...gth sample rate and horizontal scale are dependent variables When you change the record length you can choose to hold either the sample rate or the horizontal scale constant The remaining variable wil...

Page 223: ...f Use the increment decrement buttons to set the duration to touch and hold for activating the right click menus Touch the Test Area to validate that the right click menus work by touch Click the Cali...

Page 224: ...ption or application documentation Behavior Information about installed options and applications is listed in the installation dialog box The installation is acknowledged when complete To run external...

Page 225: ...ccurrence of the trigger event Time base System Triggers the Acquisition system to start an acquisition cycle In more general terms synchronizes the capturing of digital samples in the Acquisition sys...

Page 226: ...cord channel being acquired is filled 6 If averaging or enveloping is on the record becomes part of the multi acquisition record that these modes produce The process loops back to step 3 to acquire ad...

Page 227: ...ition or to delay the window relative to a trigger event and to control where in the input signal data stream that the horizontal acquisition window acquires See note For more background on acquisitio...

Page 228: ...input channel DC coupling connected through a DC blocking capacitor AC coupling or not connected at all GND coupling The input resistance of each input channel is 1 M or 50 To properly terminate sign...

Page 229: ...windows on screen Vertical Acquisition Window Considerations You can set the vertical scale position and offset of each channel independently of other channels Vertical scale and offset specify the ve...

Page 230: ...ay control Figure B shows how vertical position moves the waveform graticule vertically in the acquisition window to place the acquired waveform in the graticule display That is all position does it d...

Page 231: ...ition Determines where the trigger event will be located in the waveform record To see more pretrigger data move your trigger position to the right on the graticule Horizontal Position Determines the...

Page 232: ...l acquisition window must fit in the 10 horizontal division display for most cases you can set the Time Duration of the horizontal acquisition window 10 divs x the scale setting as described below By...

Page 233: ...mes that Horizontal Scale is held constant You can hold the Sample Rate constant instead by clicking Hold Sample Rate constant on the Record Length tab of the User Preferences control window Independe...

Page 234: ...rds Refer to Signal Connection on page 227 for further description of scaling positioning and DC offsetting of channels Sampling Process Acquisition is the process of sampling an analog signal convert...

Page 235: ...en during acquisition Record Length The number of samples required to fill a waveform record Trigger Point The trigger point marks the reference zero time in a waveform record All waveform samples are...

Page 236: ...M Two 2 5 GS sec 4 M 8 M with Option 3M Three or Four 1 25 GS sec 2 M 4 M with Option 3M Once you set the horizontal scale to exceed the maximum digitizing rate for the number of channels in use the i...

Page 237: ...wo or four input channels depending on your model The channel that you select as a trigger source will function whether it is displayed or not AC Line Voltage is often used to look at signals related...

Page 238: ...no waveform is displayed Auto trigger mode enables the instrument to acquire a waveform even if a trigger does not occur Auto mode uses a timer that starts after a trigger event occurs If another trig...

Page 239: ...before the trigger is the pretrigger portion The part that occurs after the trigger is the posttrigger portion A longer posttrigger period my be useful when you want ot see the effects an event has o...

Page 240: ...width Runt pulses can also be qualified by the logical state of other channels Width Trigger A width trigger occurs when the instrument detects a pulse that is inside or outside some specified time r...

Page 241: ...ocked NAND If not all of the preconditions selected for the logic inputs3 are TRUE then the instrument triggers OR Clocked OR If any of the preconditions selected for the logic inputs3 are TRUE then t...

Page 242: ...ted for the logic inputs3 are TRUE then the instrument triggers NAND Clocked NAND If not all of the preconditions selected for the logic inputs3 are TRUE then the instrument triggers OR Clocked OR If...

Page 243: ...ine if a clock or data transition has occurred The setup and hold times that together define a time range relative to the clock Data that changes state within the setup hold violation zone triggers th...

Page 244: ...of time or by the logical state of other channels Video Trigger Use the Video trigger to trigger the instrument on specified fields or lines of a composite video signal Select from several preset vide...

Page 245: ...ing sequential triggers In most cases you will set separate trigger sources for the A Main and B Delayed triggers Sequential triggering for Trigger after Time or Trigger on nth Event is available for...

Page 246: ...can be used with any trigger setup You can turn horizontal delay on and off from the front panel the Horizontal Acquisition control window and many of the Trigger control windows The following figure...

Page 247: ...ows all combinations of triggering and horizontal delay Display Overview This instrument includes a flexible customizable display that lets you control how waveforms appear The following figure shows...

Page 248: ...g on the graticule split setting the upper graticule displays unmagnified waveforms and the lower graticule displays magnified waveforms 3 The Horizontal scale readout provides a quick overview of the...

Page 249: ...math and reference waveforms only Enable the waveform display The following table summarizes this process as it applies to the different types of waveforms Waveform To define To display Channel Ch1 C...

Page 250: ...zoomed graticule The display elements are the same for each graticule Customizable Display Elements The following table lists customizable display elements and their points of access Display attribut...

Page 251: ...n between record points Dots display waveform record points as dots on the screen Inten Samp Intensified Samples shows the actual samples on interpolated waveforms Screen Text Display menu Screen Text...

Page 252: ...s Green Monochrome Green displays waveforms in shades of green Areas of the waveform with the highest sample density appear in lighter green shades and the areas of lowest sample density appear in dar...

Page 253: ...r the multipurpose knobs to manually adjust the display intensity when AutoBright is Off When AutoBright is On the intensity of the waveform changes automatically to provide a visible waveform Display...

Page 254: ...Delay has expired without any screen activity When LCD Backlight Timeout is On and the time in Delay has expired the screen blanks out When LCD Backlight Timeout is Off the screen display remains on D...

Page 255: ...l Reference Point The time value you set for horizontal position is measured from the trigger point to the horizontal reference point This is not the same as the time value from the trigger point to t...

Page 256: ...Phase require two sources The following automatic measurement categories are available Amplitude Time More miscellaneous Histogram Communication The instrument can take and update up to eight measure...

Page 257: ...wherever you want them on the waveform they are easier to localize to a waveform segment or feature than automatic measurements Cursors can measure channel reference and math waveforms You must set t...

Page 258: ...dialog box Each cursor readout relates to the amplitude and time base settings of its source Vertical Cursors Measure from the Trigger Point Remember that each vertical cursor measures the time from t...

Page 259: ...nts Cursor Types Because cursor measurements give immediate feedback on the amplitude or time values they measure they are usually quick to take and are more accurate than graticule measurements Also...

Page 260: ...pically volts and horizontal parameters typically time or frequency Histograms The instrument can display histograms constructed from the selected waveform data You can display both vertical voltage a...

Page 261: ...ouded by background noise You can obtain a cleaner waveform by subtracting the background noise from your original waveform Or you can integrate a single waveform into an integral math waveform as sho...

Page 262: ...be used in math expressions For example you can measure the average of a waveform using the measurement capabilities of the instrument and subtract it from the original waveform to define a new math w...

Page 263: ...math expression You do so by applying numerical constants math operators and functions to operands see Sources on page 264 You can display and manipulate these derived math waveforms much like you can...

Page 264: ...data supplied to the math waveform Changes to the vertical offset setting for a channel source that clip its data also clip the waveform data supplied to the math waveform Changes to the acquisition m...

Page 265: ...ows you to display a derivative math waveform that indicates the instantaneous rate of change of the waveform acquired Derivative waveforms are used in the measurement of slew rate of amplifiers and i...

Page 266: ...rors in the derivative waveform Use vertical position and vertical offset to position your source waveform The vertical position and offset will not affect your derivative waveform unless you position...

Page 267: ...in controls with the frequency domain controls to provide a complete spectral analyzer Signals may be represented by their characteristics in both the time and the frequency domain By combining and tr...

Page 268: ...Time controls Gate controls Frequency controls Magnitude controls Phase controls Source Position Center dB dBm linear real imaginary degrees radians group delay Duration record length Duration Span R...

Page 269: ...nd a width control The gate position is the time in seconds from the trigger location to the center 50 position of the gate interval see the figure below The position and width units are seconds The g...

Page 270: ...ral waveform Center is equal to the start frequency plus one half of the span The adjustment range depends on the sample rate and the current span setting Remember that the span must always be in the...

Page 271: ...scale of the magnitude spectrum to dB Use the Reference Level Offset to set which vertical position in the magnitude spectrum will be zero dB The following equation applies dB 20 log X Ref Where X is...

Page 272: ...ithout changing the Reference Level control setting Sometimes it is beneficial to adjust this control so that the peak of a fundamental is at zero dB Then you can measure other harmonics in terms of h...

Page 273: ...l analyzer then wraps the data with discontinuities in the display from 180 to 180 degrees Phase unwrap will display the correct result by unwrapping the phase Phase unwrap is only valid when the phas...

Page 274: ...Before computation of the spectral transformation the window is multiplied sample by sample times the input data in the gated region The window function affects the shape of the spectral analyzer resp...

Page 275: ...t samples when no zero fill is used The bandwidth is measured between the points on the lobe that are 3 dB down from the peak of the lobe The bandwidth in hertz may be computed by dividing the BW in b...

Page 276: ...se is to be correct when doing impulse response testing the impulse in the time domain must be located at this position in the gate interval Coefficients These are used to generate the windows that ar...

Page 277: ...e the figure below This means the data samples in the gate are not modified before input to the spectral analyzer This window has the narrowest resolution bandwidth of any of the windows but it also h...

Page 278: ...the way to zero at the ends This makes it a good choice if you wanted to process the real and imaginary parts of the spectrum off line and inverse transform it back to the time domain Because the data...

Page 279: ...losses see the figures below Choose the one that best allows you to view the signal characteristics you are interested in The Blackman Harris has a low amount of energy leakage compared to the other w...

Page 280: ...280 Blackman Harris window...

Page 281: ...windows It also has a wider resolution bandwidth but lower side lobe attenuation Also it is unique because the time domain shape has negative values The Flattop2 window is useful for high accuracy mag...

Page 282: ...up to one sample interval There are only two samples per cycle of a signal that has a frequency equal to one half of the sample rate This is the highest nonaliased signal that can be output from the...

Page 283: ...different frequency locations Another way to recognize aliasing is to realize that higher order harmonics usually have decreasing magnitudes compared to lower order harmonics Thus if you see a series...

Page 284: ...in the Measurement setup window for the available measurements The Serial Mask Testing key features are Predefined masks for testing or triggering on industry standard signals such as ITU T G 703 ANSI...

Page 285: ...nt making it easier to pass a mask test Positive numbers make it harder to pass and allow you to perform margin testing on your design If a user defined mask has more than three segments turning on ma...

Page 286: ...izontal mean of the left crossing point at TCross1 TCross1sigma the horizontal standard deviation of the left crossing point at TCross1 TCross1pk pk the horizontal peak to peak deviation of the left c...

Page 287: ...also set up your own mask to use with comm triggers Limit Testing Concepts Limit testing is the ability to compare an active signal with a template waveform The following figure shows an active wavefo...

Page 288: ...instrument for displaying and analyzing a certain signal Save a series of setups to help automate a procedure through recall of a sequence of saved setups as part of performing the procedure Save a s...

Page 289: ...th your mouse or the touch screen to enter the waveform path name file name and comments The instrument recalls each waveform into one of the reference waveform locations Ref1 Ref4 You cannot recall i...

Page 290: ...ATLAB creates files DAT in a format usable by MATLAB Mathcad creates files DAT in a format usable by MathCad Note that the MathCad file is an ASCII file the first four values of which contain header i...

Page 291: ...h the time and frequency domain The Flattop2 window is good for high accuracy magnitude measurements for signals that do not require narrow resolution bandwidth The Tek Exponential window is useful fo...

Page 292: ...lysis represents a repeating waveform that starts and ends at or near the same voltage of a cycle In other words it is an integer number of cycles When a waveform starts and ends at the same amplitude...

Page 293: ...g Rectangular Best frequency worst magnitude resolution This is essentially the same as no window Transients or bursts where the signal levels before and after the event are nearly equal Equal amplitu...

Page 294: ...t frequency resolution use as wide a gate as possible Aliasing Problems occur when the instrument acquires a signal containing frequency components that are higher in frequency than the Nyquist freque...

Page 295: ...quency components that you want to view are below the built in bandwidth settings set the source channel bandwidth to the appropriate value Push the AUTOSET button Switch the acquisition to Envelope m...

Page 296: ...both the AC and DC components of an input signal AC to couple only the AC components of an input signal GND to disconnect the input signal from the acquisition system 6 Click Close to close the windo...

Page 297: ...forms to satisfy the acquisition mode Select sampling mode 5 To select the sampling mode click the Horiz toolbar button or select the Horizontal Acquisition Setup command from the Horiz Acq menu to op...

Page 298: ...ode starts when the resolution is 4 ms or greater Enable single sequence roll mode 4 Push the SINGLE button to start and acquire enough points to satisfy the acquisition mode when the waveform makes i...

Page 299: ...r Off Off is the default and erases the screen each time a new waveform array is displayed For an explanation of Variable persistence see page 140 7 If you select Variable click Persist Time and adjus...

Page 300: ...eadouts on or off 3 In the Time Stamps controls click Readouts to toggle time stamp readouts on or off Readouts use the following format Sel Ch F xxx DD MMM YYYY HH MM SS mmm nnn ppp Ref Ch F xxx DD M...

Page 301: ...Reference Frame Source and select the source of the reference frame Click Frame and use the multipurpose knob or keypad to enter the number of the reference frame To lock the reference position frames...

Page 302: ...g edge negative going signal You can also set the slope in the Trigger Setup control window Select the trigger level 4 To manually change the trigger level for edge triggers or certain threshold level...

Page 303: ...triggered Checking Trigger Status To see the state and setup of the triggering circuit use the trigger status lights readout and screen Trigger status from trigger status lights 1 To quickly determine...

Page 304: ...re accessible only through the Trigger Setup control window Holdoff Trigger level presets Force trigger Use the procedures that follow to set up these trigger parameters Set holdoff Changing the holdo...

Page 305: ...3 V level Define new trigger level presets 9 If the menu bar is not displayed click the Menu toolbar button 10 Select the Utilities menu User Preferences option The User Preferences control window op...

Page 306: ...g pulses Either looks at both positive and negative pulses 6 To specify the width of the glitch click Width and set the glitch width using the multipurpose knob or keypad 7 To specify whether to trigg...

Page 307: ...the upper threshold being crossed at all Neg looks at negative going pulses The upper threshold must be first crossed going negative then recrossed going positive without the lower threshold being cr...

Page 308: ...s procedure to detect and trigger on a pulse that is either wider or narrower than the specified range Select width triggering 1 Push the front panel ADVANCED button 2 On the Trigger Setup control win...

Page 309: ...m the list Select t he polarity 5 Select a Polarity value to specify the direction of the pulse edge Pos monitors the transition time slew rate of the positive going edges of pulses The edge must firs...

Page 310: ...oes not trigger the pulse edge may be too fast To check the pulse edge speed switch to edge triggering Trigger on the pulse edge and determine the time the edge takes to travel between the upper and l...

Page 311: ...ropriate to either the TTL or ECL logic families by clicking TTL or ECL on the Level pop up keypad Set the timer 6 To set the timeout timer click Timer and use the multipurpose knob or pop up keyboard...

Page 312: ...reshold voltages click on the channel threshold control and use the multipurpose knobs or pop up keypad to set each threshold Select logic pattern 6 Select the Boolean logic function for the combinati...

Page 313: ...rue or False when the clock channel 4 input changes state The clock input is channel 2 on 2 channel instruments Select state triggering 1 Push the front panel ADVANCED button 2 On the Trigger Setup co...

Page 314: ...output of the chosen pattern function for example from AND to NAND or NOR to OR Set mode and holdoff 9 Mode and holdoff can be set for all standard trigger types Refer to trigger mode on page 137 and...

Page 315: ...TTL or ECL on the Level pop up keypad Set the setup and hold times 9 Click Setup Time and use the multipurpose knob or pop up keypad to set the setup time relative to the clock 10 Click Hold Time and...

Page 316: ...nd holdoff 11 Mode and holdoff can be set for all standard trigger types Refer to trigger mode on page 137 and Set holdoff on page 122 to learn more about trigger mode and holdoff Set up and hold viol...

Page 317: ...strument when the signal enters or leaves the window defined by the threshold levels Inside Limits and Wider Than or Outside Limits and Wider Than Trigger the instrument when the signal enters or leav...

Page 318: ...Interlaced or Progressive and Scan Rate Custom scan rates enable you to trigger on non broadcast video signals that have unique scan rates Select the scan rate that includes your signal 15 20 kHz 20 2...

Page 319: ...procedure to set up the instrument to trigger on a sequence Prerequisites 1 The instrument must be installed with a signal connected to an input channel Set the acquisition system to RUN and set the...

Page 320: ...up command 2 To specify which channel becomes the B trigger source click Source and select the source from the list 3 Click Coupling and select the trigger coupling to match your trigger signal 4 To s...

Page 321: ...onstrates the display adjustments you can make Prerequisite 1 The instrument must be installed with a signal connected to an input channel Set the acquisition system to RUN Set vertical display parame...

Page 322: ...veform s of interest 6 Push the front panel MultiView Zoom HORIZ or VERT button to select the axis that you want to focus on in the zoom graticule The Zoom control window opens if it is not already pr...

Page 323: ...oom 13 To reset all Zoom settings to their defaults click the Position Factor Reset button in the Zoom Setup control window Taking Automatic Measurements Use this procedure to quickly take a measureme...

Page 324: ...t measurement on the list is removed To remove any measurement click the name on the Measurements list to highlight the measurement and click Clear You can also click and drag to select and clear seve...

Page 325: ...nob or pop up keypad to set High Ref to define the high reference level The default level is 90 Mid Ref to define the middle reference level The default level is 50 Low Ref to define the low reference...

Page 326: ...4 to set the gated area to the waveform area contained in the Zoom 1 4 area Off to turn off measurement gating You can also turn gating off from the Zoom shortcut menu 6 If you selected Cursor you mus...

Page 327: ...of the other cursor Tracking makes both cursors move in unison and maintain a fixed horizontal or vertical distance between each other 8 To turn the display of the cursors on or off push the front pa...

Page 328: ...e selected histogram on and off Select histogram scale 7 Click a Histogram Scaling option Linear displays histogram data linearly Bin counts smaller than the maximum counts are scaled linearly by divi...

Page 329: ...ion appears in the window You can still use the waveform by clicking Clear which discards the previous math expression You may also want to select another waveform Select an expression 4 Click one of...

Page 330: ...Once you have defined the math expression to your satisfaction click Apply Apply is available on the Equation Editor and Spectral Setup control windows Using Math Waveforms Use the same techniques to...

Page 331: ...gth If you adjust these settings for sources of a math waveform the adjustments are reflected in the math waveform Take automatic measurements 5 Click the Meas toolbar button to open the Measurement S...

Page 332: ...an 1 tab 5 Click Offset and using the multipurpose knobs or keypad set the offset to 900 mV and the Ch1 Scale to 200 mV Display the spectral math waveform 6 From the toolbar click Math and select the...

Page 333: ...splays the difference in frequency and amplitude between the cursor locations as shown below Defining a Spectral Math Waveform Use this procedure to define a spectral math waveform First ensure that t...

Page 334: ...n adjust the scale and position by clicking the waveform handle and using the multipurpose knobs 10 To set the reference level click Reference Level and use the multipurpose knobs or pop up keypad to...

Page 335: ...to zero see Using the Phase Controls on page 273 for an example See Using the Phase Controls on page 273 for additional information on suppression threshold Set time and frequency domain control track...

Page 336: ...ion of the acquired waveform record length click Duration and use the multipurpose knobs or pop up keypad to adjust the duration Note Changing duration also changes the record length 24 Gate position...

Page 337: ...adout Read the frequency of each cursor relative to the zero frequency point from the cursors readout Setting Up Mask Testing To set the instrument to perform mask tests do the following procedure Pre...

Page 338: ...or vertical settings of the instrument This control is also on the main mask setup window Autoset the signal 9 In the Masks tab click the Autoset button to have the instrument automatically adjust ins...

Page 339: ...l the test and the delay time the time from when mask test starts to when the instrument begins sampling 15 Use the Failure field buttons to set what the instrument does when a mask test fails have th...

Page 340: ...the More button to display further selections Note Industry standard masks are available with Option SM Only User masks are the only mask type available without Option SM 3 Select a standard from the...

Page 341: ...p to 50 vertices Move a vertex 7 Click the Horizontal field and use the multipurpose knob or keypad to change the selected vertex horizontal position 8 Click the Vertical field and use the multipurpos...

Page 342: ...sk Access the Mask Setup window 1 From the button bar click Masks and select the Masks tab 2 Click the User Mask button 3 Click the Edit User Mask button The instrument displays the Mask Edit control...

Page 343: ...lick the Edit User Mask button to display the user mask edit functions 8 Click the Segment field and use the arrow buttons multipurpose knob or keypad to enter or select segment 1 9 Click the Vertex A...

Page 344: ...e that you want use for the limit test If the template that you want to use is stored in a location other than Ref1 4 then you must first recall the template waveform to one of the reference locations...

Page 345: ...ult location on the instrument hard drive 8 Click Send to send a test e mail Set up e mail on Limit test failure 1 See Using Limit Testing on page 344 to set up the limit test 2 Under Failure Notifica...

Page 346: ...System Properties dialog box click the Hardware tab 5 Click the Device Manager button Select the source 6 Double click Sound video and game controllers 7 Double click SigmaTel C Major Audio 8 In the D...

Page 347: ...e formats wfm is an internal instrument format csv is usable by spreadsheets such as Microsoft Excel dat is usable by Mathcad and MATLAB txt is the standard text file format 9 If your file type is oth...

Page 348: ...e entire screen select Full screen to select an image of the selected graticule select Graticule s only select Hide Menu Toolbar check box if you do not want the menu and toolbar included 6 Select the...

Page 349: ...r your file or type a unique name in the Name text box or select an existing name from the Name list data in the existing file will be overwritten OR Select the Auto increment file name check box to s...

Page 350: ...elect the Include waveform scale factors check box if you want to include waveform details like header information record length sample interval trigger point information and so on If you only want to...

Page 351: ...ow You can also move a control after it has been placed in the new control window by dragging it 6 To remove the control from the custom control window select it and then click the Delete button Creat...

Page 352: ...window to edit 2 Select the MyScope control window that you want to edit from the Open MyScope Control Window dialog box The control window that you selected opens in the MyScope Setup control window...

Page 353: ...Use this procedure to optimize gain and offset accuracy at the probe tip Allow the instrument to warm up for 20 minutes before performing this procedure If you have not already done so perform the low...

Page 354: ...e is 75 ns 10 Repeat steps 8 and 9 for each additional channel that you want to deskew 11 Remove the connections from the probe compensation terminals Note To compensate for timing differences between...

Page 355: ...path compensation Warmup The instrument has not warmed up for 20 minutes Wait for the instrument to warm up for at least 20 minutes before running the signal path compensation procedure Low Frequency...

Page 356: ...rms without typing in a large number of unique file names 1 Click Save on the toolbar or click Save As from File menu 2 Select Waveform from the Save As dialog box 3 From the Source list select the wa...

Page 357: ...at you want to recall 3 Select Ref1 4 from the Destination list 4 Click Recall Creating a Spectral Waveform Use these steps to display a spectral FFT magnitude waveform 1 Set the source signal Vertica...

Page 358: ...10 Click the of Frames field and then use the lower multipurpose knob to enter the total number of frames that you want to view 11 The selected range of frames is displayed with the frames superimpos...

Page 359: ...xternal monitor to the Video port upper VGA port on the side panel of the instrument 3 Power on the instrument and the external monitor 4 After the instrument display appears click Minimize on the Fil...

Page 360: ...rom the Math menu Creating Math Waveforms with the Equation Editor Use the following steps to create math waveforms using the Equation Editor 1 Open the Math Setup control window by clicking Math on t...

Page 361: ...d disconnecting the power cord to shut down the instrument Note It may be necessary to hold the On Standby switch for up to 20 seconds for the shutdown process to initiate To completely remove power t...

Page 362: ...k into the disk drive and then follow the on screen instructions to create the startup disk Backing Up User Files Always back up your user files on a regular basis Use the Windows Backup tool to back...

Page 363: ...our Tektronix representative for purchasing information Follow the installation instructions that come with the application Run the application software from the File menu From the File menu select th...

Page 364: ...o position the histogram box over the area of interest on the waveform 5 Click Limits button under the Adjust Histogram Box and then use the multipurpose knobs to adjust the size of the histogram box...

Page 365: ...log box 2 Click the Images tab 3 Select the Palette View and Image as needed for your application 4 Click Copy to paste the image to the clipboard You can now paste the bitmap image into your other ap...

Page 366: ...a new name each time Note The data in reference waveforms is not saved with instrument setups However the setup information includes which reference waveforms are turned on and which are used with ma...

Page 367: ...ay of an analog oscilloscope Areas of the waveform with the highest sample density appear in lighter shades while the areas of lower sample density appear in darker shades Use the Temp temperature pal...

Page 368: ...veform pairs that you want to use 2 Click Appearance on the Display menu or click Disp on the toolbar and then click the Appearance tab 3 Click the center button under Display Format to select XY Disp...

Page 369: ...network setup program in the Windows Start menu if you select Settings Control Panel and then double click Network Consult with your network administrator for specific instructions for these settings...

Page 370: ...Both ends of the banner The Summary Waveform is a screen shot that gives you an overall view of what was originally on the screen before printing began It contains information that will not appear on...

Page 371: ...control window or by right clicking on the waveform handle and then selecting Invert from the shortcut menu Connecting Probes Connect the probe tip and the ground lead to the two probe compensation c...

Page 372: ...il Setup tab and then set the rest of the test parameters 8 From the Pass Fail Setup tab or the Pass Fail Results tab click the Pass Fail Test control to run the test Creating a User Mask with Option...

Page 373: ...ask Edit Setup from the Masks menu to display the Mask Edit Setup control window 2 Click Recall to open the Recall dialog box 3 Click User Mask under Recall What and then click the mask that you want...

Page 374: ...sitions for all channels in parallel Amplitude This voltage measurement is the high value minus the low value measured over the entire waveform or gated region Amplitude High Low Analog Oscilloscope S...

Page 375: ...mple rate divided by two the Nyquist frequency minus one half the span The minimum center frequency is equal to one half of the span If the frequency span is set to maximum then the center frequency w...

Page 376: ...source Control Window Handle Cos Inserts the text COS into the math expression Cosh Inserts the text COSH into the math expression The COSH function computes the hyperbolic cosine of x Crossing Perce...

Page 377: ...been processed If dead time is long the instrument can miss acquiring infrequent events Dead time Between Acquisitions Delay This timing measurement is the time between the mid reference default 50 am...

Page 378: ...n a reference waveform saved in FastAcq mode ExtdB 10xLog pTopMean pBaseMean Extinction Ratio Percent Extinction ratio percent is the ratio of eye base to top expressed as a percentage This measuremen...

Page 379: ...stopped Frame A frame is a segment of the entire data record When used with FastFrame each segment contains all the data of a single acquisition Each captured event is stored sequentially in its own f...

Page 380: ...ion of rise and fall times To change this level click the control and then set the level with the multipurpose knob Histogram Max Displays the voltage of the highest nonzero bin in vertical histograms...

Page 381: ...FFT Increment Decrement Buttons Integral Inserts the text INTG into the math expression Enter an argument to the function The integral function produces the integral of the argument Invert Inserts the...

Page 382: ...h H low L or don t care X A value is considered high if the channel input voltage is greater than the specified threshold voltage a value is considered low if the channel input voltage is less than th...

Page 383: ...then set the level with the multipurpose knob Magnitude Inserts the text SpectralMag into the math expression Select one of the waveforms as an argument to the function This function creates an FFT m...

Page 384: ...imum Value Inserts the text MIN into the math expression The MIN function accumulates over time the minimum value at each point in the vector Multipurpose Knobs Natural Antilog Inserts the text EXP in...

Page 385: ...l as specified by you To ensure accurate noise values be sure to set the signal type to Eye when measuring an Eye signal Noise RMS PTopsigma or PBasesigma Normal Trigger Mode Normal trigger mode cause...

Page 386: ...rams display the time of the rightmost nonzero bin minus the time of the leftmost nonzero bin Pop up Keypad Positive Duty Cycle This timing measurement is the ratio of the positive pulse width to the...

Page 387: ...off the reference point is the trigger point Resolution Bandwidth The resolution bandwidth controls the bandwidth of the spectral analyzer filters You can adjust the resolution bandwidth in units of h...

Page 388: ...te range that includes your signal 15 20 kHz 20 25 kHz 25 35 kHz 35 50 kHz or 50 65 kHz Scallop Loss Scallop loss is the difference between the actual magnitude and the computed magnitude of a signal...

Page 389: ...e PTopsigma or PBasesigma Sin Inserts the text SIN into the math expression SinH Inserts the text SINH into the math expression Smallest Integer Inserts the text CEIL into the math expression The CEIL...

Page 390: ...low for the specified time Click Either to trigger the instrument if the signal has not crossed the threshold value for the specified time Timeout Value The timeout value determines when the instrume...

Page 391: ...SC signals and the mV graticule is normally used with all other video signals Trigger Holdoff After a trigger event the instrument will not accept another trigger event until after the holdoff value i...

Page 392: ...ive or negative glitches Trigger Polarity Runt and Transition Time Trigger Select the polarity from the drop down list Click Positive to trigger on a positive going pulse Click Negative to trigger on...

Page 393: ...low if the channel input voltage is less than the specified threshold voltage Use the don t care selection for any channels that will not be used as part of the pattern Note The Logic qualification o...

Page 394: ...s from the drop down list NTSC PAL SECAM 1080i 60 1080p 24 720p 60 480p 60 1080i 50 1080p 25 or 1080 24sF Video Trigger Holdoff Specify Holdoff By Time or By Fields and use the multipurpose knob to ch...

Page 395: ...395 XY format pairs When you use the XY display format channel and reference waveforms are assigned to the axis indicated in the following tables You cannot display math waveforms in XY format...

Page 396: ...02 103 RUN STOP button 58 Sample mode 102 103 SINGLE button 58 starting and stopping an acquisition 58 window 84 91 acquisition channels 228 Acquisition modes setting 297 Acquisition Preview 249 Acqui...

Page 397: ...Considerations 232 AUX OUT connector 52 Auxiliary input connector 52 Auxiliary Trigger 237 Average acquisition mode effects of 282 Averaging 226 330 B B Event trigger 121 Backing Up User Files 362 Ba...

Page 398: ...355 signal path 354 355 Configure e mail 220 Configure mask 173 Connect signal 227 Connecting probes 46 371 Connection signal and probes 228 Connectivity tools 40 Connectors 52 61 Audio port 61 COM1 6...

Page 399: ...62 Measurement Statistics 163 moving 45 Page Setup Dialog Box 69 Position Scale 82 Probe Calibration 87 Recall Instrument Setup 67 Reference Levels 164 Reference waveform 64 Resolution 101 Run Stop 13...

Page 400: ...trol Windows 351 Creating MyScope Control Windows 351 Creating Your Own Control Windows 47 cursor 152 154 355 Cursor Position control window 152 Cursor Setup control window 150 Cursor Type Control Win...

Page 401: ...e 100 Delayed trigger 239 Delete 69 setups 69 waveforms 69 deskew 354 Deskew control window 89 interaction with fast acquisition 89 procedure 46 354 diagnostics 219 digital oscilloscopes 48 Digital Si...

Page 402: ...214 Edit mask 189 Edit menu 74 Edit menu options 74 Copy 365 366 Copy Setup 74 75 Select for Copy 365 Edit MyScope 214 Editing a User Defined Mask 341 Editing a User Mask 373 Editing MyScope Control...

Page 403: ...veforms 197 with Roll mode 108 FastFrame Setup control window 111 feedback 33 FFT 291 creating waveforms 357 display 292 features 291 magnitude waveforms 357 phase waveforms 204 process 291 window cha...

Page 404: ...ctional Model 225 G gate position 269 Gate Width 270 gating 153 326 Gating control window 165 Zoom window 165 Gating Controls 269 Gaussian Window 276 defined 276 glitch trigger 123 240 defined 240 Gli...

Page 405: ...ion Scale 98 Resolution 101 Run Stop 137 Zoom Controls 79 Zoom Graticule 77 Zoom Lock 78 Zoom Setup 77 Horizontal acquisition 231 232 Horizontal acquisition window 229 233 horizontal bar cursors 153 h...

Page 406: ...ied samples 139 140 INTENSITY knob 48 59 140 Interaction of acquisition features 109 interface 44 Interleaving Affects on sample rate 236 Interpolation 255 inverting channel waveforms 371 J jitter 50...

Page 407: ...Trigger Level Control 183 Vertical Controls 182 Mask Autoset Mode 183 Mask Configuration 181 184 Autofit Control Window 184 Autoset Control Window 181 Display Control Window 181 Mask controls 180 Mas...

Page 408: ...Spectral Setup 202 Math Setup control window 196 Math variables 200 Math Variables control window 202 Math Waveform Differentiation 265 Math Waveform Sources 264 dependencies 264 math waveforms 197 2...

Page 409: ...eviation 163 statistics 163 vertical 154 Menu Bar mode 23 42 minimizing the oscilloscope display 361 Minimum Value 384 Min Max mode 256 Model numbers 23 monitor 39 52 359 360 Mouse connecting 61 movin...

Page 410: ...ion 31 Persistence 148 250 Phase Controls 273 phase measurement 160 167 setup 167 168 Phase Reference Position 273 274 Phase scale 335 Phase Unwrap 273 phase waveform 49 198 204 pop up 30 keyboard 44...

Page 411: ...troubleshooting 370 Probe Calibration control window 87 Probe Status 87 probe calibration procedure 88 353 active probes 353 passive probes 353 restrictions 95 probe compensation 46 87 88 370 adjustin...

Page 412: ...angular Window 277 defined 277 Reference Colors 252 Reference Level 271 272 Reference Level Offset 271 272 Reference Levels control window 64 164 Reference Levels Method 257 Reference Waveform Control...

Page 413: ...ontrol 228 Scallop Loss 275 Screen Capture Dialog Box 70 screen elements 28 screen objects 143 Screen Text 142 250 251 screen text properties 147 Segmented Memory 111 Selecting the Sound Source 346 Se...

Page 414: ...ware applications 361 adding 361 removing 361 Source 174 cursor 326 327 Masks 174 math waveforms 264 sources for automatic measurements 256 Span 270 specifications 31 spectral analysis 49 209 294 387...

Page 415: ...ort information 32 Suppression Threshold 273 Syntax 264 Math Waveform Expression 264 T Taking Automatic Measurements 323 Tan 390 Tanh 390 TDS5000 Series options 53 technical support 32 Tek Exponential...

Page 416: ...ate 127 Mode 137 Run Stop 137 Trigger 237 238 239 240 Concepts 236 Coupling 239 Delayed 239 Modes 238 Position 239 Slope and Level 239 Sources 237 Transition Time 240 Types 237 Trigger codes 130 138 T...

Page 417: ...upling 239 Holdoff 238 239 Modes 238 Sources 237 Trigger coupling 239 Trigger holdoff 238 Trigger modes 238 Trigger sources 237 Trigger types 237 Types 237 238 Triggering with comm triggers 287 trigge...

Page 418: ...Control Windows 212 Using Zoom 256 Using Zoom with Waveforms 322 Utilities menu 215 Utilities menu options 215 Deassign Multipurpose Knobs 56 External Signals 217 GPIB Configuration 216 Instrument Cal...

Page 419: ...splay 249 250 Waveform Display control window 81 Waveform Integration 266 Waveform Intensity 253 Waveform Interpolation 250 Waveform Label control window 82 Waveform Options Dialog Box 71 Waveform rec...

Page 420: ...riggering 317 window trigger 128 244 defined 244 windows 359 360 dockable 359 Windows interface 39 Z Zero Phase Reference 275 276 Zoom 47 48 142 256 graticule 47 using 322 ZOOM button 47 79 Zoom contr...

Reviews: