Using Solar-Log WEB
74 of 131
Solar-Log
1000
User Manual
Udc
: Generator voltage. To display voltage of the individual strings
only one inverter may be selected.
kWp
: Converting the scaling from "Output in watts" to "Output in
kWh/kWp". This makes all of the curves comparable in terms of their
specific output. This also makes it easier to identify decreased
outputs from specific inverters/strings.
24h
: Display showing the output over 24 hours of the day for a
complete visualisation of the power consumption over the course of
one day
Additional functions using S0 meter reader
The following displays are also available to you by connecting an S0
meter reader to the Solar-
Log™:
S0
: Shows the power consumption for your building as a graph in
watts.
Cons
.: Shows the power consumption for your building as a rising
line in kWh.
Values
: Shows various values for your inverter in text form.
Balance
: Shows you the ratio of your power consumption to your
power yield. In the lower left text field the ratio is also shown as a
percentage.
Additional functions with the sensor box
Solar
: Shows the reference value of an irridation sensor. The daily
output of the plant must be within the measuring range of the sensor.
Mod T
: Shows the module temperature. The temperature is detected
by the sensor box.
3
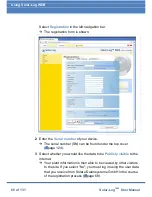
Click on one of the buttons and then on the magnifying glass symbol.
The selected curve is shown.
5.3.4 Month overview
Select
Overview Monthly
in the navigation menu.
Summary of Contents for Solar-Log 1000
Page 1: ......

