


Operation using the web browser in your own network
Solar-Log
1000
User Manual
15 of 131
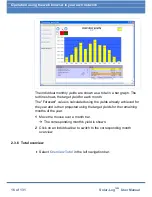
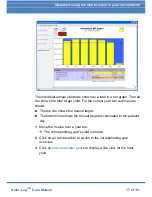
The daily yields for one month are shown as a total in a bar graph. The
red line shows the target yield for each month.
1
Move the mouse over a day bar.
The corresponding day's yield is shown.
2
Click on an individual bar to switch to the corresponding day
overview.
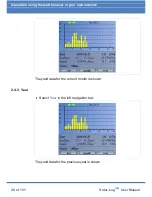
2.3.5 Year overview
Select
Overview Yearly
in the left navigation bar.
Summary of Contents for Solar-Log 1000
Page 1: ......